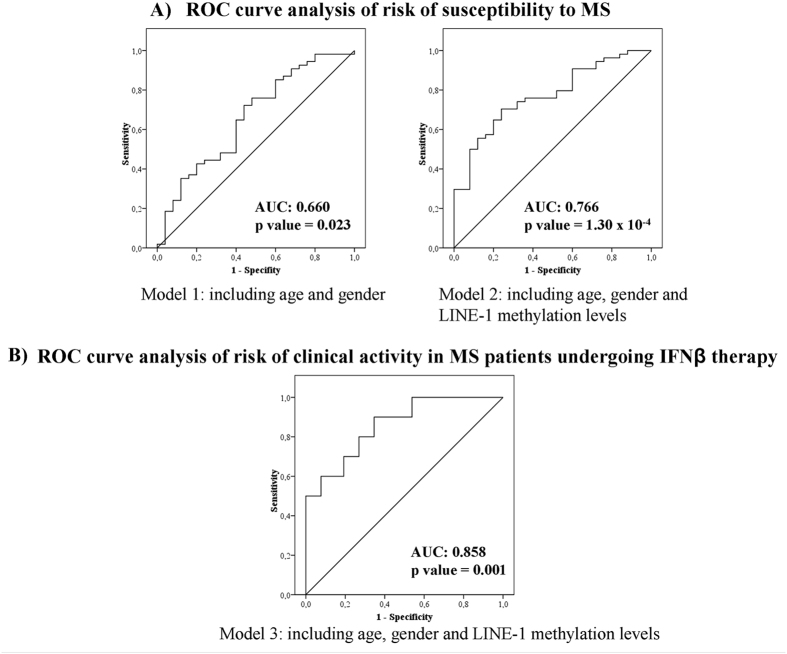
Figure 1.
Receiver operating characteristic (ROC) curves for the multivariate logistic regression analysis for the three risk models. Roc curve analysis was performed with the data of probability predicted by the logistic regression models for each individual of the sample, in each of the models. The area under the ROC curve (AUC) is the discriminating power of the performed model. ROC curve analysis of: (A) Risk of susceptibility to MS. The predictive capacity was increased when LINE-1 methylation levels were included. The model 2, including LINE-1 methylation levels, had a larger AUC and a higher statistical significance than model 1 including age and gender, exclusively. (B) Risk of clinical activity in MS patients undergoing IFNβ therapy. LINE-1 methylation levels had a significant predictive capacity.

