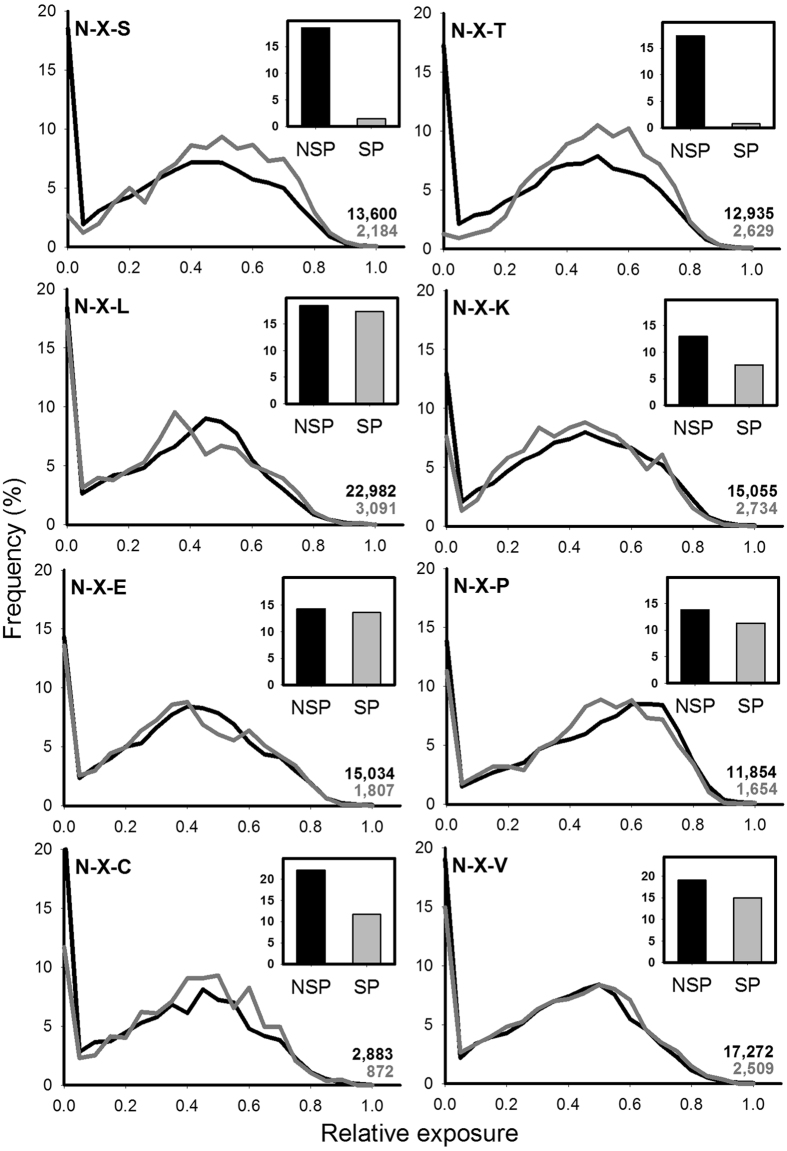
Figure 3.
Surface exposure distribution of Asn residues in SP and in NSP proteins. The main graphs show the distribution of exposure of Asn residues in the selected tripeptides for NSP (black lines) and SP proteins (gray lines), where X can be any residue. The total number of Asn analyzed for NSP and SP proteins is indicated in black and gray, respectively. Inset show the percentage of buried Asn in each curve (exposure values below <5%).

