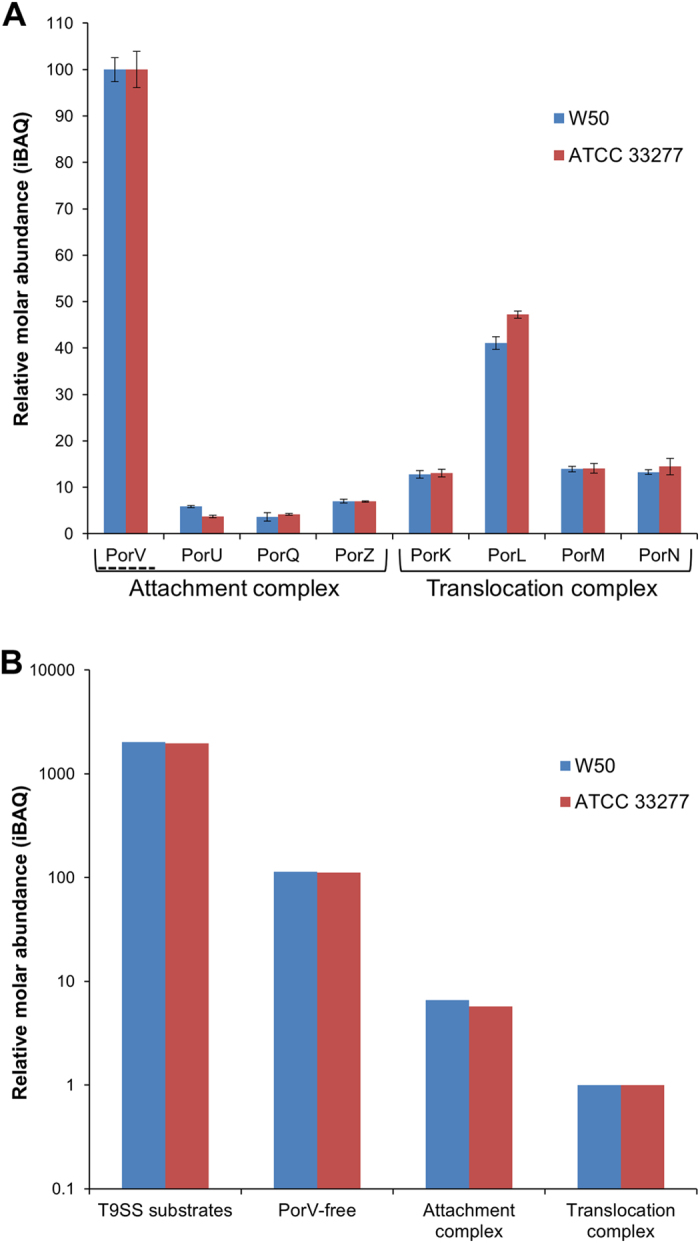
Figure 8.

Stoichiometry of the proteins and complexes involved in substrate delivery. Whole cell lysates of WT strains W50 and ATCC 33277 were digested with trypsin and analysed by LC-MS/MS. Three replicate injections were analysed and quantitated using MaxQuant software. The iBAQ metric was used as an estimate of the relative molar abundance of each protein. (A) Relative abundance of components plotted on a linear scale with the abundance of PorV set to 100 for each strain. Error bars represent the standard deviation of the mean. PorV is mostly free with only a small portion present in the attachment complex. (B) Relative abundance of protein complexes plotted on a logarithmic scale. The translocation complex comprising PorK, PorL, PorM and PorN was set to a relative abundance of 1 based on the average iBAQ values of PorK, PorM and PorN. The iBAQ values of the other three categories were multiplied by 16 relative to the translocation complex to account for the differing number of subunits. The value of the attachment complex was taken as the average of the values for PorU, PorQ and PorZ. This value was then subtracted from the total PorV to give the value of free PorV.
