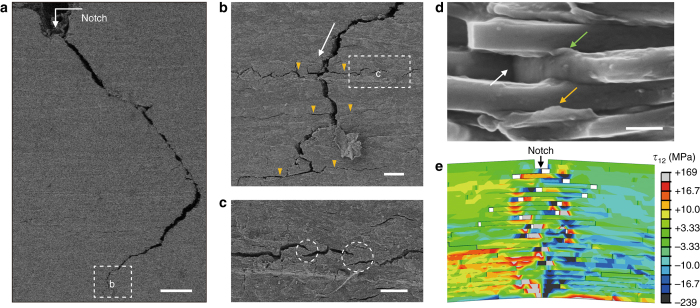
Fig. 3.
Multiple extrinsic toughening mechanisms acting at multiple length scales. a Long-range crack deflection. White arrow indicates the initial crack near the notch. Scale bar, 200 μm. b Crack deflection, branching, and multiple cracking. White arrow indicates the extension direction of the main crack. Yellow arrows indicate the onset of crack branching. Scale bar, 20 μm. c Crack bridging toward the end of a crack path. Scale bar, 10 μm. d Details of the fracture surfaces showing polymer bridging, stretching, and platelets’ pulling out. White arrow indicates the cavity resulted from platelet pull-out. Green arrow shows the polymer bridging between adjacent platelets. Yellow arrow displays that the polymer stretching resulted from interface failure. Scale bar, 400 nm. e Microcrack deflection and crack bridging near the crack tip by progressive interface failure via nonlinear finite element model (FEM) simulation. τ 12 means the shear stress

