Figure 2.

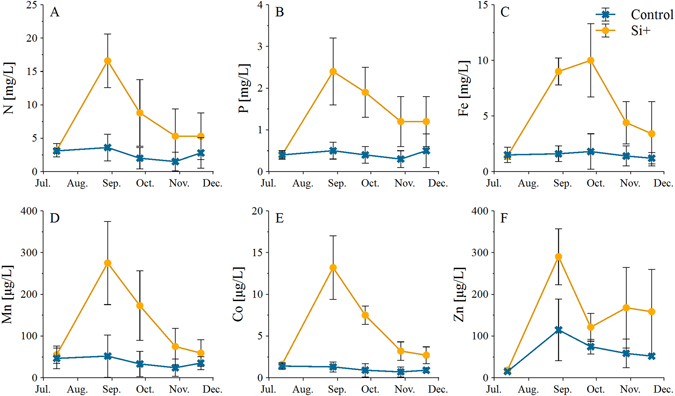
Mean ± SD values of N, P, Fe, Mn, Co, and Zn concentrations in pore water under high (Si+) and low (control) Si availability, n = 4. Note that N, P, and Fe concentrations are plotted in mg/L, whereas Mn, Co, and Zn are plotted in µg/L.

Mean ± SD values of N, P, Fe, Mn, Co, and Zn concentrations in pore water under high (Si+) and low (control) Si availability, n = 4. Note that N, P, and Fe concentrations are plotted in mg/L, whereas Mn, Co, and Zn are plotted in µg/L.