Figure 1.

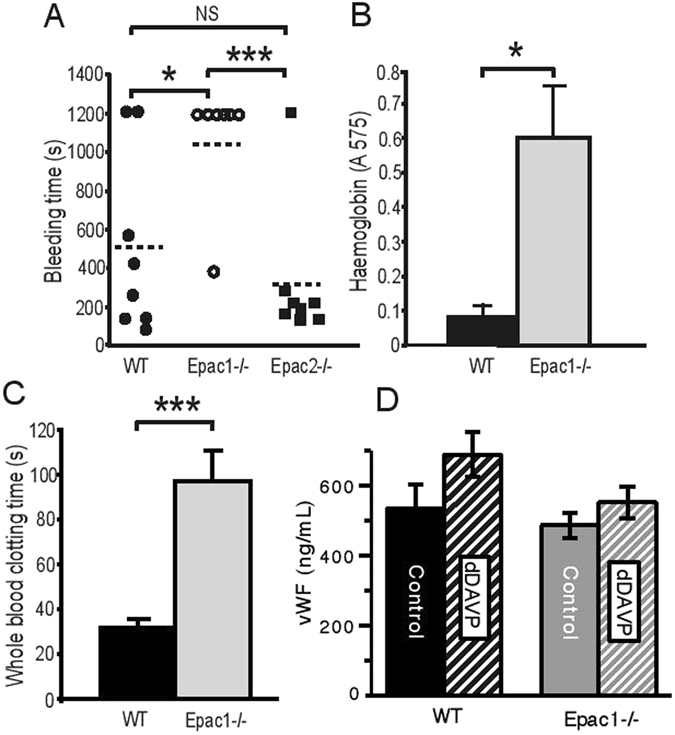
Epac1 −/− mice have increased bleeding time. (A) Tail bleeding time in WT (n = 8), Epac1−/− (n = 7) and Epac2−/− (n = 8) mice. Each point represents the measurement from one mouse. The horizontal dotted lines represent average tail bleeding time. 1200 seconds marks the experimental end point. (B) Blood loss quantified as amount of hemoglobin (absorbance at 575 nm) released during the tail bleeding test in WT (n = 8) and Epac1−/− mice (n = 7). (C) Whole blood clotting time in WT (n = 6) and Epac1−/− (n = 7) mice. (D) The plasma levels of vWF, determined by ELISA, 1.5 h after i.p. injection of 0.9% NaCl in WT (n = 4) and Epac1−/− mice (n = 5), or of dDAVP (1ng/g bodyweight) in WT (n = 4) and Epac1−/− mice (n = 5). The values shown are mean + /− SEM. NS = not significant, *P < 0.05, ***P < 0.005 ANOVA (A) and Student’s t-test (B, C, D).
