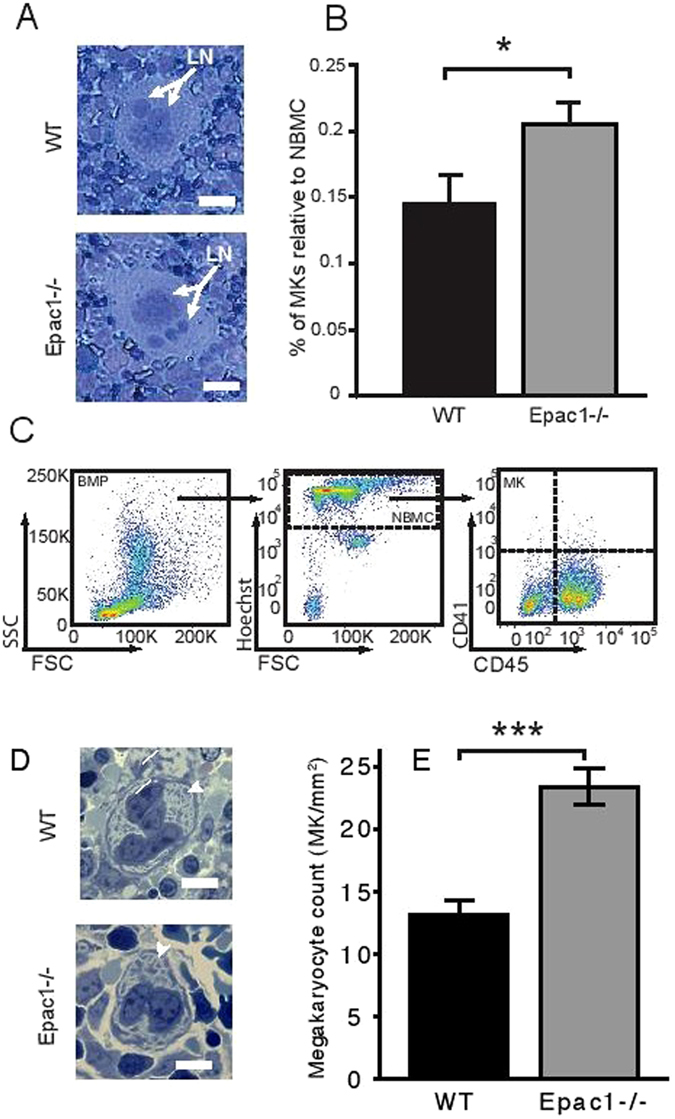
Figure 3.

Increased number of megakaryocytes in adult bone marrow and embryonic liver. Representative micrographs of May-Grünwald Giemsa stained bone marrow megakaryocytes from WT and Epac1−/− mice. (B) Flow cytometric determination of bone marrow megakaryocytes numbers in Epac1−/− (n = 9) and WT (n = 10) mice. (C) Flow cytometric scatter plots with the gating strategy used to obtain data in B are shown. (D) Toluidine-stained sections of mouse embryonic livers showing megakaryocytes Arrowheads indicate demarcation membrane. (E) Number of megakaryocytes per mm2 in livers from WT (n = 5) and Epac1−/− (n = 7) embryos (E14). Data are average and + /− SEM. LN; lobulated nucleus, BMP; bone marrow population, NBMP; nucleated bone marrow population, MK; megakaryocytes. *P < 0.05, ***P < 0.005, Student’s t-test. The bars indicate 20 μm in A and D.
