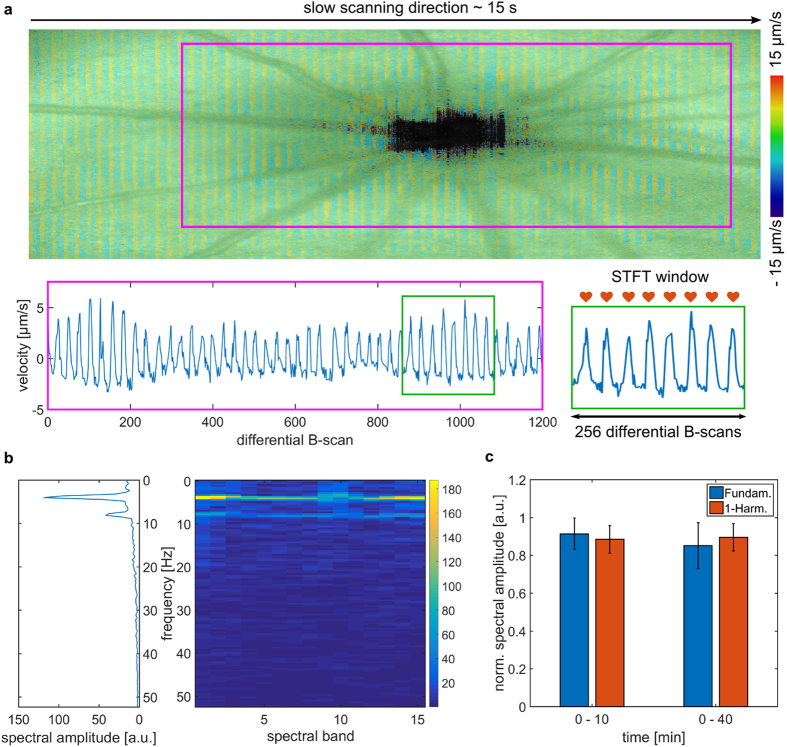
Figure 2.
Fundus pulsation analysis and repeatability measurements. (a) An exemplary fundus pulsation map overlaid on the corresponding reflectivity en-face projection at physiological IOP. Fundus pulsations were determined as velocity between retinal and chorioscleral complex. The velocities were averaged for each B-scan and subsequently analyzed by a STFT within a sliding window depicted in green. (b) The spectrogram showing the 15 spectral bands determined by the STFT and average spectral amplitude for the fundus pulsations shown in (a). The average spectral amplitudes were calculated for the fundamental oscillation as well as for the first harmonic. (c) The repeatability was investigated in a short time range of approximately 10 minutes (3 measurements each) as well as on a longer time span of approximately 40 minutes (total of 5 measurements each) for three rats. The normalized mean spectral amplitudes of the fundamental oscillation as well as of the first harmonic are shown, where error bars indicate the standard deviation.

