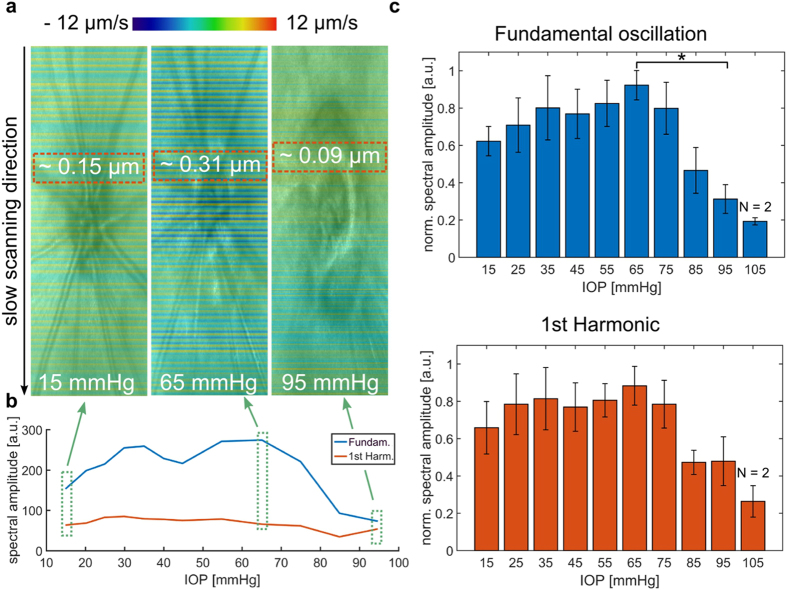
Figure 3.
Spectral analysis of ocular fundus pulsations as a response to an elevated IOP. (a) Pulsation changes illustrated as a color-coded overlay on the en-face reflectivity projections at three different IOP levels (15, 65, and 95 mmHg). A stronger stripy pattern, in comparison to the initial IOP level, was noticed at IOP of 65 mmHg while the pulsations almost vanished at 95 mmHg. (b) Pulsatile response to an increased IOP shown for one rat exemplary. (c) Pulsatile response to an elevated IOP for four rats (N = 4) in a range of 15 to 105 mmHg. Error bars indicate the standard deviation. The spectral amplitude was normalized for each rat to the maximum spectral response. A significant drop was noticed between 65 mmHg and 95 mmHg in the fundamental osciallation. The analysis of the first harmonic showed a similar behavior, but no statistically significant trend was observed. (*significant difference: p < 0.05).

