Figure 5.
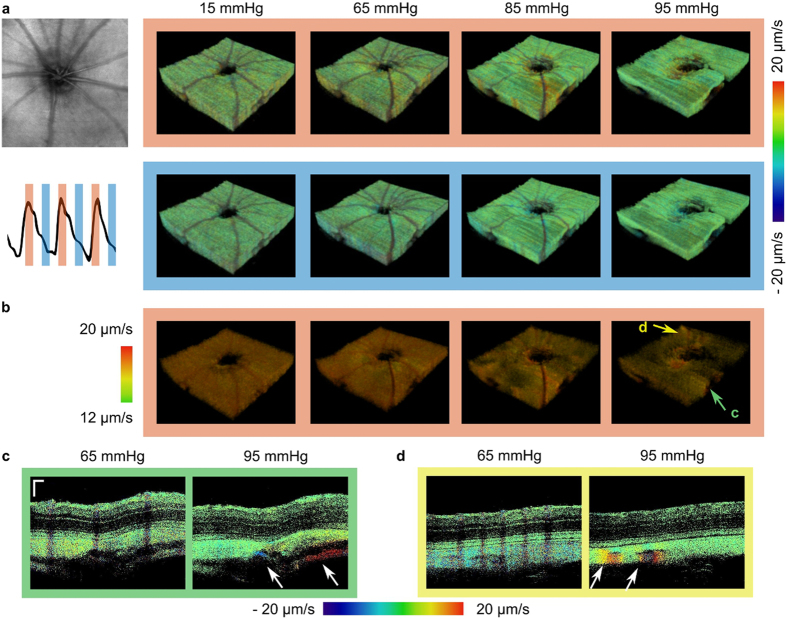
Time gated visualization of ocular fundus pulsations. (a) The recorded volumes were time gated according to the heart cycle for visualization. The top row shows 3D renderings of the CS complex at four different IOP levels ranging from 15 mmHg to 95 mmHg at the instance of maximum deformation. The bottom row shows the corresponding volumes at half a heart cycle later. (b) Volumes are shown for motions exceeding 12 μm/s for the same datasets as shown in (a). Locally increased deformations were identified at higher IOP levels while the overall pulsatility decreased with increased IOP above 65 mmHg. (c,d) B-scans at the locations indicated by arrows in (b) are shown at IOPs of 65 mmHg and 95 mmHg, respectively. Regions undergoing increased deformations were identified around the ONH and larger choroidal vessels. (scale bar = 100 μm).

