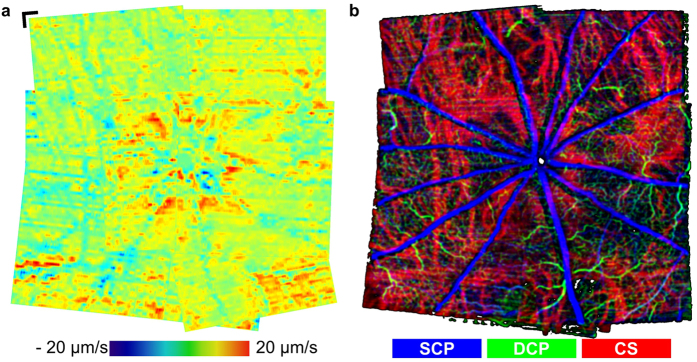
Figure 6.
Extended field-of-view fundus pulsation maps and OCTA at physiological IOP. (a) Pronounced deformations were encountered around the ONH and close to major choroidal blood vessels in some peripheral regions. A time lapse of time gated fundus pulsations along one heart cycle is shown in Supplementary Video 2. (b) Extended field-of-view OCTA image. The depth positions of the three plexuses are color coded in this OCTA image. The superficial capillary plexus (SCP) containing the retinal nerve fiber layer, ganglion cell layer and the inner plexiform layer, the deeper retinal capillary plexus (DCP) in the outer plexiform layer as well as the chorioscleral (CS) plexus are shown in blue, green and red, respectively. Regions of increased pulsatility were identified as regions containing major blood vessels in the OCTA images of the choroid. (scale bar = 150 μm).

