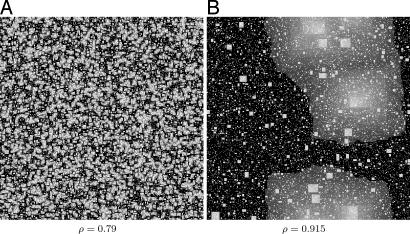
Fig. 4.
The two regimes. Shown are configurations (L = 400) after partial removal of particles via parallel updating. The two examples refer to the unstable regime (A) and the metastable regime (B), lying respectively to the left and right of the peak in the Fig. 1 Inset. The process is stopped after removal of 50% of the particles (black) (the gray scale representing the time during the process when the particles were removed).

