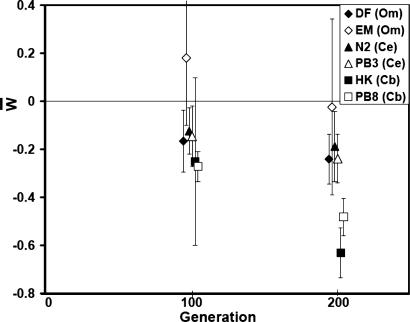
Fig. 1.
Plot of total fitness (W̄) of MA lines, scaled to the control mean, against number of generations of mutation accumulation. Error bars represent ± 2 SEM; see Methods and Materials for details. Diamonds are O. myriophila, triangles are C. elegans, and squares are C. briggsae. Ancestral control fitness is represented at generation 0.

