
Figure 5.
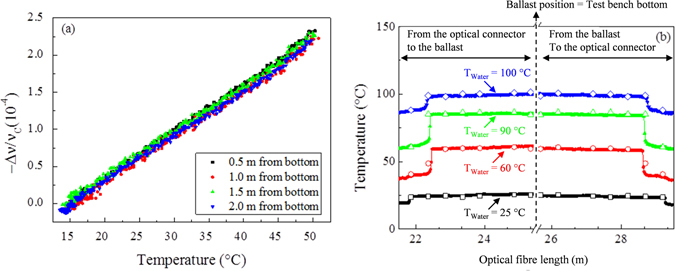
Distributed temperatures in operating and accidental conditions. (a) Temperature calibration curves during water heating (15–50 °C) around four different thermocouple positions along the test bench height. (b) Temperature evolution along the fibre length inside the test bench (sensor probe) at four different situations during the experiment: operating condition with water at ~25 °C (black solid dots), operating condition with water at ~60 °C (red solid dots), accidental condition with water at ~90 °C and (green solid dots), accidental condition with water at ~100 °C, presence of steam inside the chamber and boiling water (blue solid dots). The open dots in each curve represent the temperature values detected with the thermocouples placed along the test bench height.