Figure 1.
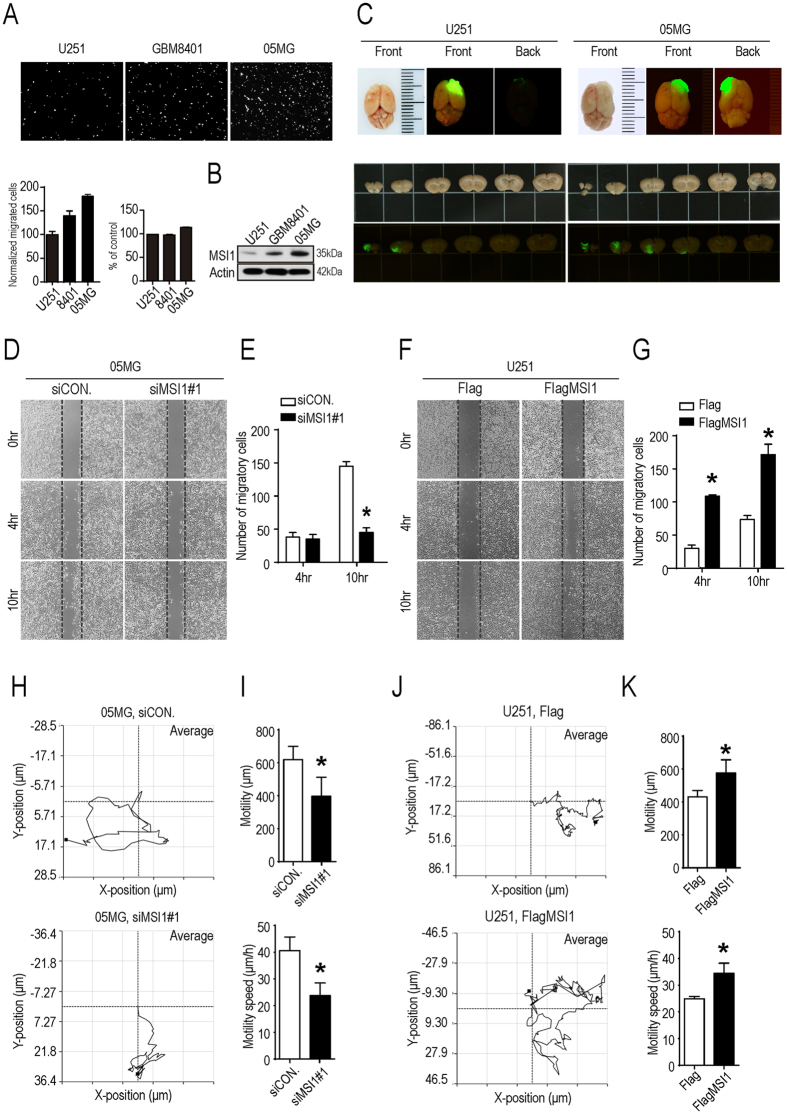
MSI1 promoted GBM cells migration. (A) U251, GBM8401, and 05MG GBM cell lines were subjected to a 24-hour Transwell migration assay. Cells were plated in the upper chamber, after 24 hours plating, migrating cells that moved to the underside of the filters were fixed and stained with PI (Propidium iodide). Relative cell migration was determined by the number of the migrated cells normalized to the total number of the cell, and the value from U251 cell was arbitrarily set at 100%; the percentage of cell numbers were indicated by alamar blue assay shown in bar chart. (B) Western blot analysis of MSI1 expression in U251, GBM8401 and 05MG cell lines, of which the uncropped blots were demonstrated in Supplementary Figure 5. (C) SCID mice were orthotopically transplanted with 1.5 × 10⁵ GFP-labeled U251 or 1.5 × 10⁵ GFP-labeled 05MG cells. Representative tumor photographs of GFP images were taken 63 days after transplantation. (D,E) 05MG cell transiently transfected with siRNA against MSI1 (siMSI1) or scrambled siRNA control (siCON.), and the number of migrated cells at 4 and 10 hours were calculated. (F,G) U251 cells were transiently transfected with Flag-tagged MSI1 (FlagMSI1) or Flag control (Flag), and the number of migrated cells at 4 and 10 hours were presented as the bar chart. MSI1-depleted 05MG (H,I) and MSI1-overexpressed U251 cells (J,K) were seeded in 3.5-cm plates prior to the image acquisition using time lapse microscopy for single-cell tracking (1 frame/5 min for 24 hours). The mean tracks of 15 cells were shown in the left panel. The mean motility and speed of cells was determined by the manual tracking plugin of Image J in three independent analyses and shown as bar chart in the right. Each column and bar showed the mean ± SEM. The experiments were repeated at least three times. The statistical significance was assessed by one-way ANOVA, *P < 0.05 (relative to the control group).

