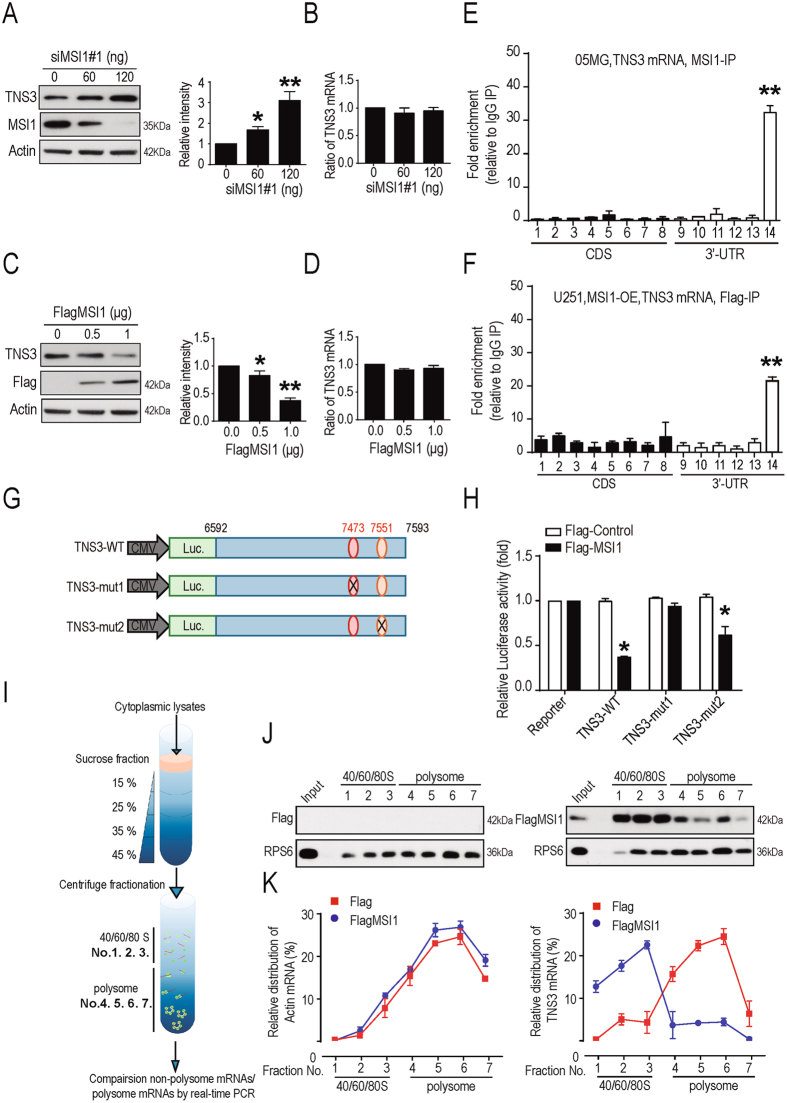
Figure 4.
MSI1 repressed TNS3 translation through binding to its 3′UTR. GBM 05MG cells were transiently transfected with 0, 60 and 120 ng of siMSI1. TNS3 and MSI1 expression levels were analyzed 48 hours after transfection by (A) Western blotting and (B) Real-time PCR. U251 cells were transient transfected with 0, 0.5 and 1 μg Flag-MSI1. TNS3 and MSI1 expression levels were analyzed 48 hours after transfection by Western blotting (left), and the results were quantified as bar chart (right) and Real-time PCR (D). (E,F) RNA-ChIP assay was performed in endogenous MSI1 in 05MG cells and exogenous Flag-MSI1 in MSI1-overexpressed U251 cells. The bar chart indicates the gene expression fold change after normalization to IgG-precipitated controls. (G) Schematic representation of the reporter constructs containing the firefly luciferase fused to wild-type or mutated TNS3-3′UTR. (H) Luciferase reporter assays were conducted in U251 cells with or without MSI1 expression. The bioluminescent signal of each TNS3-3′UTR reporter were shown as relative fold change to their respective luciferase positive control. (I) Schematic illustration showing the sucrose gradient centrifugation. The gradient used in this study was 15% at the top and 45% at the bottom. Whole-cell lysates are prepared and layered carefully on top of the gradient. After centrifugation, the top 3 fractions (No. 1 to 3) of the gradient were dissembled ribosomal subunits (40/60/80 S, non-translation fraction,) and the bottom 4 fractions (No. 4 to 7) were the assembled ribosomes (polysome, translation fraction). (J,K) Flag-control and MSI1-overexpressed U251 cells were subjected to sucrose gradient centrifugation. Samples from each fraction were analyzed by Western bolt. Relative levels of TNS3 and actin mRNAs in each ribosome fraction were quantified and plotted as a percentage relative to the total input. The uncropped blots were demonstrated in supplementary figure 5. Data are from three independent polysomic-profiling experiments. Error bars represent mean ± SEM; n = 3. *p < 0.05; **p < 0.01 (relative to the control group).

