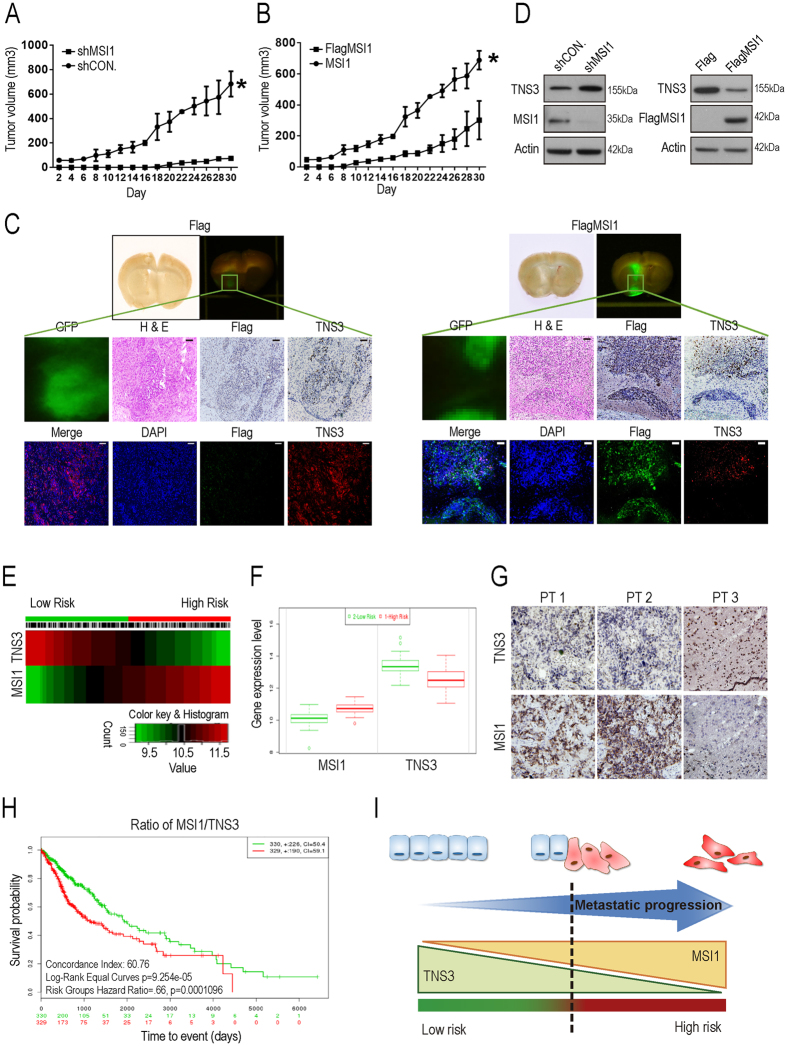
Figure 6.
MSI1/TNS3 signaling promoted in vivo tumor migration and correlated with poor patient survival. (A,B) In vivo GBM growth rate was assessed by subcutaneous tumor implantation in immunocompromised mice with 5 × 10⁵ MSI1-depleted 05MG cells or 5 × 10⁵ MSI1-overexpressed U251 cells, each facilitated with their respective controls. Tumor volume was measured by caliper. Data were presented as mean ± SEM (n = 12). *p < 0.05 (relative to the control group). (C) SCID mice were orthotopically implanted with 1.5 × 10⁵ GFP-labeled U251-Flag-control or 1.5 × 10⁵ GFP-labeled U251-MSI1-ovexpressed cells. Representative photographs of fluorescent images were taken 63 days after inoculation. The GFP-labeled GBM tumors can be observed and the tumor sections were subjected to H&E, IHC, and IF staining to assess tumor malignancy, spreading, as well as the expression of MSI1 and TNS3. (D) Tumor tissue was harvested and homogenized for western blotting to assess MSI1 and TNS3 protein levels ex vivo. The uncropped blots were demonstrated in Supplementary Figure 5. Correlation of survival rates and MSI1/TNS3 gene expression in GBM patients. (E) Heat map of MSI1 or TNS3 mRNA expression of GBM patient samples along with the risk factor. The high and low risk groups were split of the same size depending on the Prognostic Index estimated by beta coefficients multiplied by gene expression values. (F) Box plots generated by SurvExpress showed the expression levels of MSI1 or TNS3 and the P-value resulting from a T-test of the difference, low-risk was in green and high-risk was in red, respectively. (G) Immunohistochemical staining to determine the expression level of MSI1- or TNS3-positive cells (brown color) on paraffin-embedded specimens from GBM patients (magnification × 400). (H) Kaplan-Meier survival curves were constructed by using SurvExpress program to analyze samples of GBM from TCGA (The Cancer Genome Atlas). The ratio of MSI1/TNS3 for Low- and High-expression groups were shown in green and red, respectively. The insets showed the number of individuals, the number censored, and the CI (confidence interval) of each risk group. (I) In the presented model, MSI1highTNS3low could be used for the prediction of tumor metastatic potential and the survival outcome of patients.

