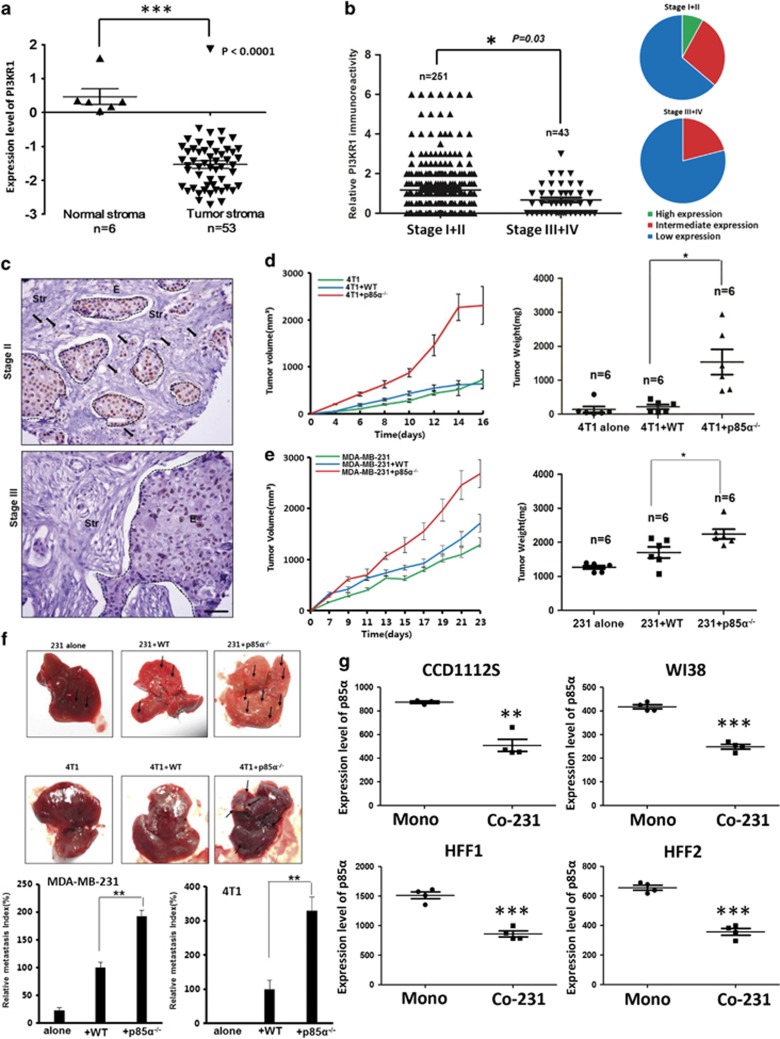
Figure 1.
Aberrant low expression of p85α in the stroma is associated with breast tumourigenesis. (a) Gene expression levels of p85α (PIK3R1) in normal and breast cancer stroma from GSE9014. Data are the mean±s.e.m. ***P-value⩽0.001. (b) Left panel: P85α expression levels in breast cancer stroma samples. Right panel: The proportion of different extent of p85α expression in various stage breast cancer stroma. Data are the mean±s.e.m. *P-value⩽0.05. (c) Representative immunohistochemical images from various breast cancer stages. Scale bar, 100 μm. Dotted lines circled structures, cancer epithelium, the arrows, significant expression of p85α in cancer stroma. (d) Tumour volume and weight measurements of 4T1 cells grown subcutaneously alone, with WT or p85α−/− fibroblasts. Each group have six mice (n=6). Data are the mean±s.e.m. *P-value⩽0.05. (e) Tumour volume and weight measurements of MDA-MB-231 cells similar to (d). Each group have six mice (n=6). Data are the mean±s.e.m. *P-value⩽0.05. (f) Quantification of liver metastases in mice described in (d and e) using H&E staining. Scale bar, 100 μm. Data are the mean±s.e.m. **P-value⩽0.01. (g) P85α expression in fibroblasts cocultured with breast cancer cells from GSE41678. Data are the mean±s.e.m. Mono, monoculture of cancer cells; Co-231, fibroblasts cocultured with MDA-MB-231. **P-value⩽0.01, ***P-value⩽0.001.

