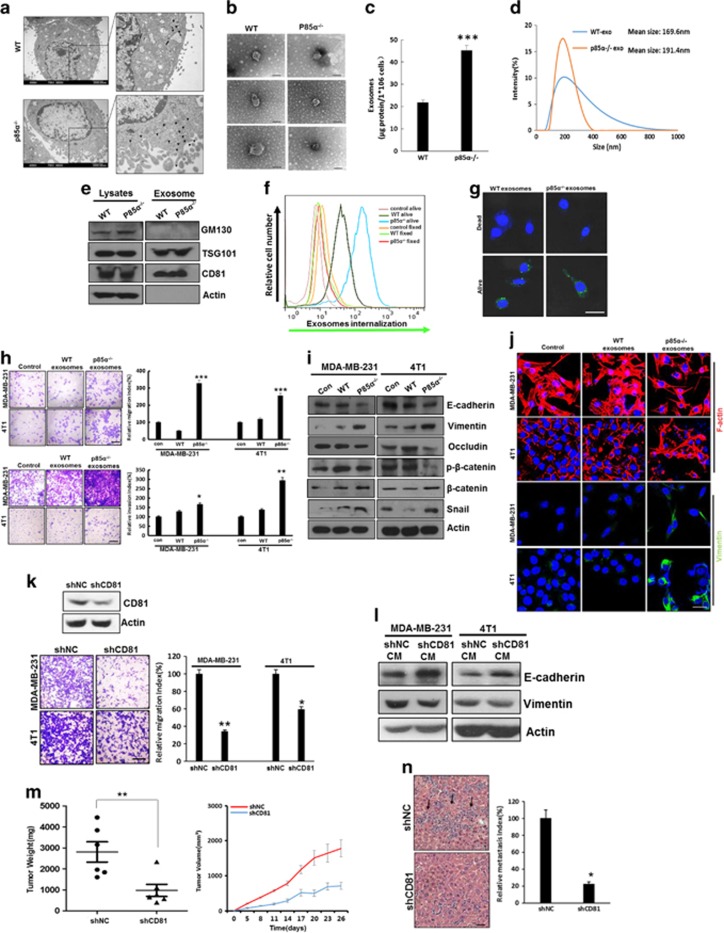
Figure 6.
Exosomes from p85α-deficient fibroblasts regulate stromal–epithelial crosstalk in breast cancer. (a) Representative electron microscopy image of WT and p85α−/− fibroblasts. Scale bar, 2000 nm. (b) Representative electron microscopy image of exosomes purified from WT and p85α−/− fibroblast-conditioned medium, each group have three replications. Scale bar, 100 nm. (c) Quantification of the exosome protein yield from WT and p85α−/− fibroblasts by BCA protein quantitation. Data are the mean±s.e.m. ***P-value⩽0.001. (d) Exosome size distribution of WT and p85α−/− fibroblasts measured by a Zetasizer analyser. (e) Western blot analysis of exosomes from WT and p85α−/− fibroblasts. TSG101 and CD81 are markers of exosomes. GM130 is a check for cellular contamination. (f) Flow cytometry of DiD dye transfer from WT or p85α−/− fibroblasts to breast cancer cells (4T1). (g) Image of DiD dye transfer from various fibroblasts to breast cancer cells (4T1) as described in (f). Scale bar, 50 μm. (h) The migration and invasion assay of MDA-MB-231 and 4T1 cells treated with exosomes purified from WT or p85α−/− fibroblast-conditioned medium. Data are the mean±s.e.m. *P-value⩽0.05. **P-value⩽0.01. ***P-value⩽0.001. Scale bar, 100 μm. (i) Western blot analysis of Wnt pathway and EMT markers in MDA-MB-231 cells and 4T1 cells treated with exosomes purified from WT or p85α−/− fibroblasts. (j) Representative immunofluorescence images of cytoskeleton and vimentin in cancer cells treated with exosomes from WT or p85α−/− fibroblasts. Scale bar, 25 μm. (k) Migration assay of MDA-MB-231 and 4T1 cells cultured in shNC or shCD81 p85α−/− fibroblast-conditioned medium. Data are the mean±s.e.m. *P-value⩽0.05. **P-value⩽0.01. Scale bar, 100 μm. (l) Western blot analysis of EMT markers in MDA-MB-231 cells and 4T1 cells cultured in shNC or shCD81 p85α−/− fibroblast-conditioned medium. (m) Tumour volume and weight measurements of 4T1 cell grown subcutaneously with shNC or shCD81 p85α−/− fibroblasts. Each group have six mice (n=6). Data are the mean±s.e.m. **P-value⩽0.01. (n) Quantification of liver metastasis in mice described in (m). Data are the mean±s.e.m. *P-value⩽0.05. Scale bar, 50 μm.

