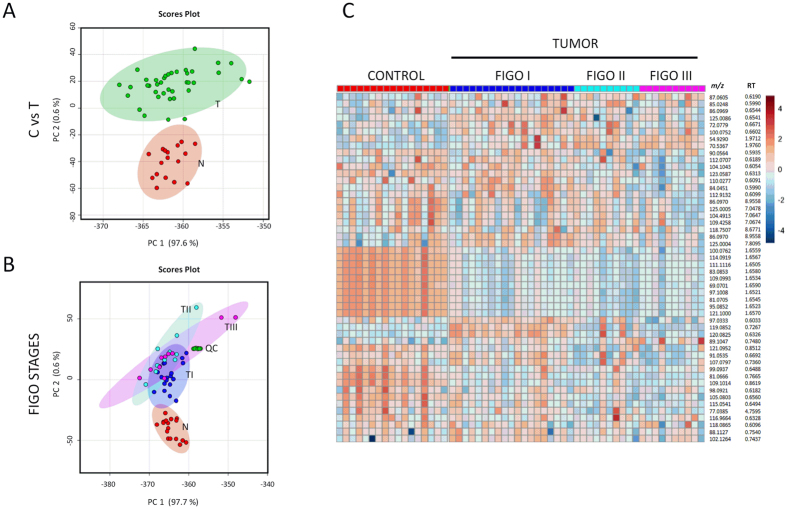
Figure 1.
Multivariate analysis showing metabolic profiles in EC. Principal Component Analysis (PCA) plots showing separation between EC tissue samples (T, in green) and control tissue samples (N, in red) (Panel A) and separation between different EC FIGO stages (stage 1: TI, stage 2: TII, stage 3: TIII) (Panel B) for the positive MS ionization mode. X-axis shows interclass separation and Y-axis illustrates the intra-class variability. Panel C. Heat map of ion rankings, corresponding to their relative concentrations (intensity) for positive MS ionization mode, in the same cohort of subjects. Each row represents a unique feature with a specific m/z and RT while each column represents a unique subject. (m/z: mass to charge ratio; RT: retention time).

