Figure 2.
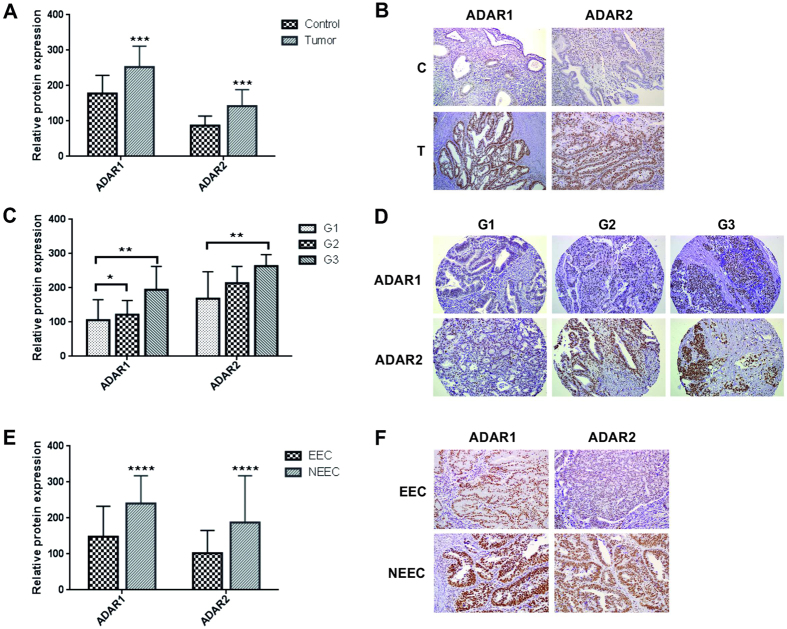
ADAR1 and ADAR2 proteins are overexpressed in EC. Panel A. ADAR1 and ADAR2 expression in EC tumors (T) compared to the paired control (C) tissues. Relative protein expression of each enzyme is plotted in the bar graphs. Panel B. Example of ADAR1 and ADAR2 staining levels in a matched EC tissue with the corresponding paired control. Panel C. ADAR1 and ADAR2 expression in EC tissues significantly correlate with the tumor grade. Panel D. Example of ADAR1 and ADAR2 staining levels in a set of 3 different EC tumor grades slides (grade 1, 2 and 3). Panel E. ADAR1 and ADAR2 levels are significantly increased in NEEC compared to EEC tumors. Panel F. Example of ADARs staining in EEC and NEEC tumors.

