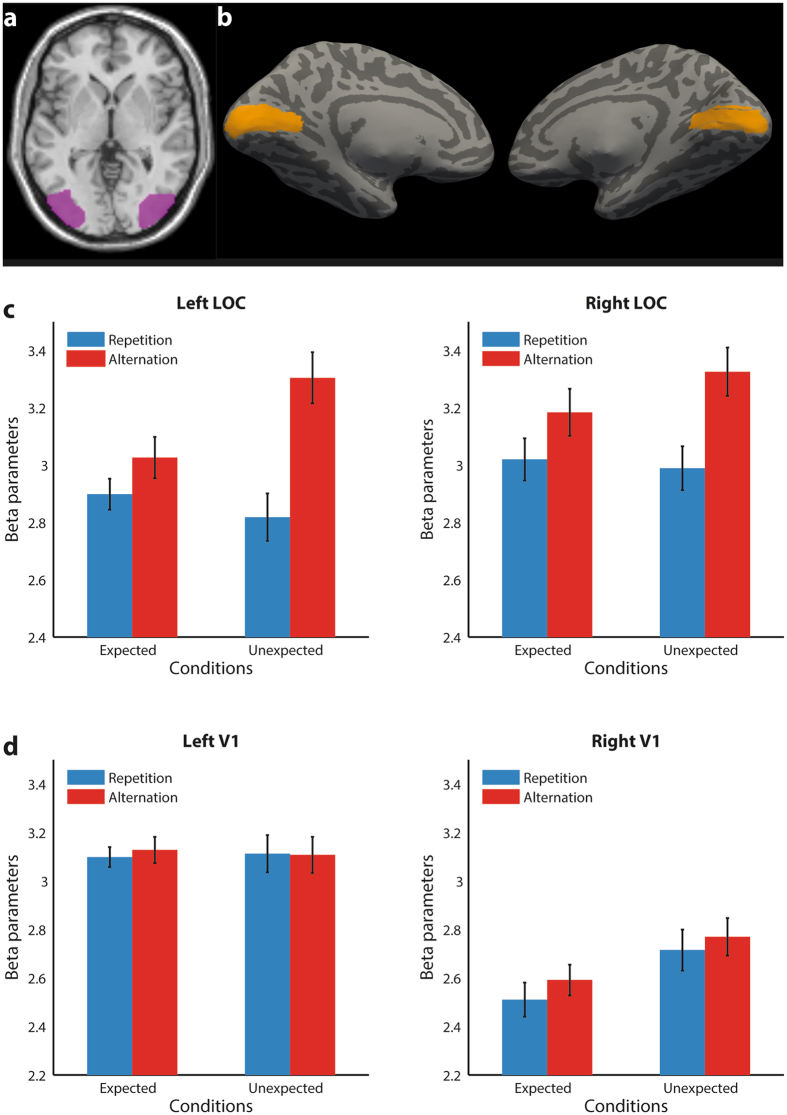
Figure 3.
fMRI ROI results. (a) LOC ROI. Panel shows in violet the group response to the object > scrambles contrast during the localizer, and superimposed on a transversal slice of SPM’s MNI template at z = 0. For each participant individually, per hemisphere the 100 most object-selective voxels were chosen within this anatomical site. (b) Reconstructed V1 (left, right) shown in yellow on an inflated brain from one representative participant. (c-d) Mean parameter estimates for LOC and right V1 per condition. Error bars reflect within-subject SEM. Additional information on the ROI and beta parameters within these ROIs can be found in the supplementary Figures S1, S2, and S5.

