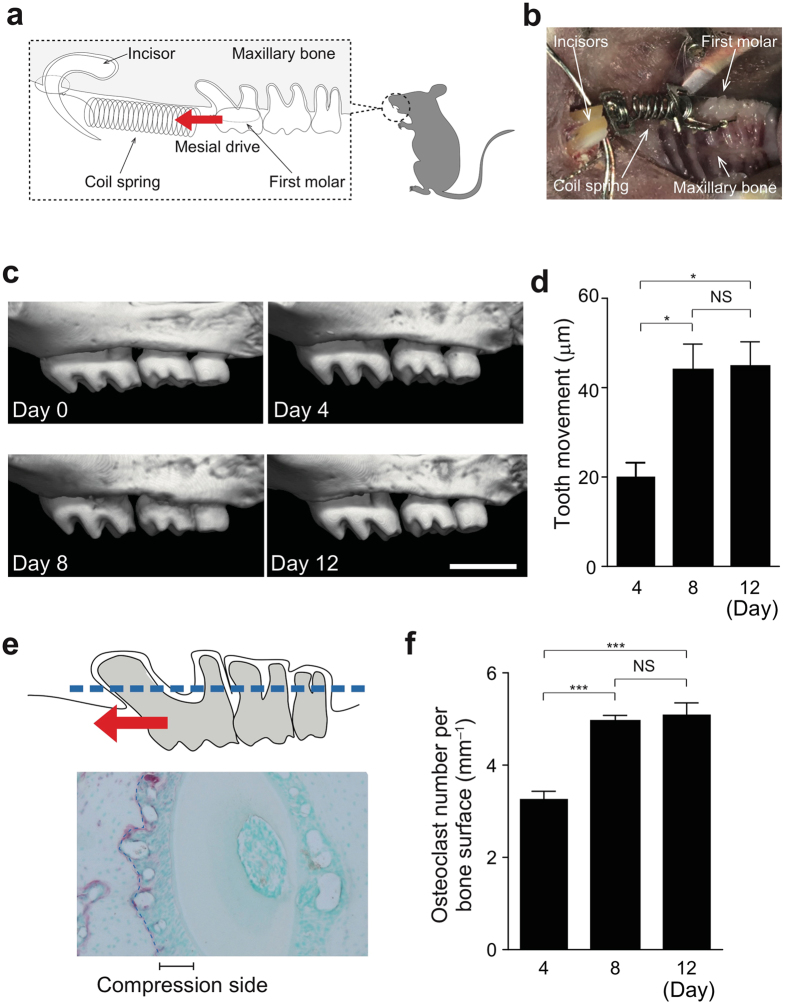
Figure 1.
Experimental tooth movement model. (a) Schematic diagram of orthodontic tooth movement. The upper first molar was moved mesially by a closed–coil spring. The red arrow indicates the direction of orthodontic force. (b) Intra–oral photograph. (c) Tooth movement during the experiment time course. Representative micro-CT images in wild–type mice after spring insertion (0, 4, 8 and 12 days). (d) Quantification of tooth movement in each group (n = 3 per time point). (e) Measurement of osteoclasts on alveolar bone around the distal buccal root of the upper first molar (area enclosed by the dotted line). (f) The number of osteoclasts on the alveolar bone surface (n = 3 per time point). Scale bar: 1 mm. Error bars, means ± s.e.m.; *P < 0.05; ***P < 0.001; NS, not significant.

