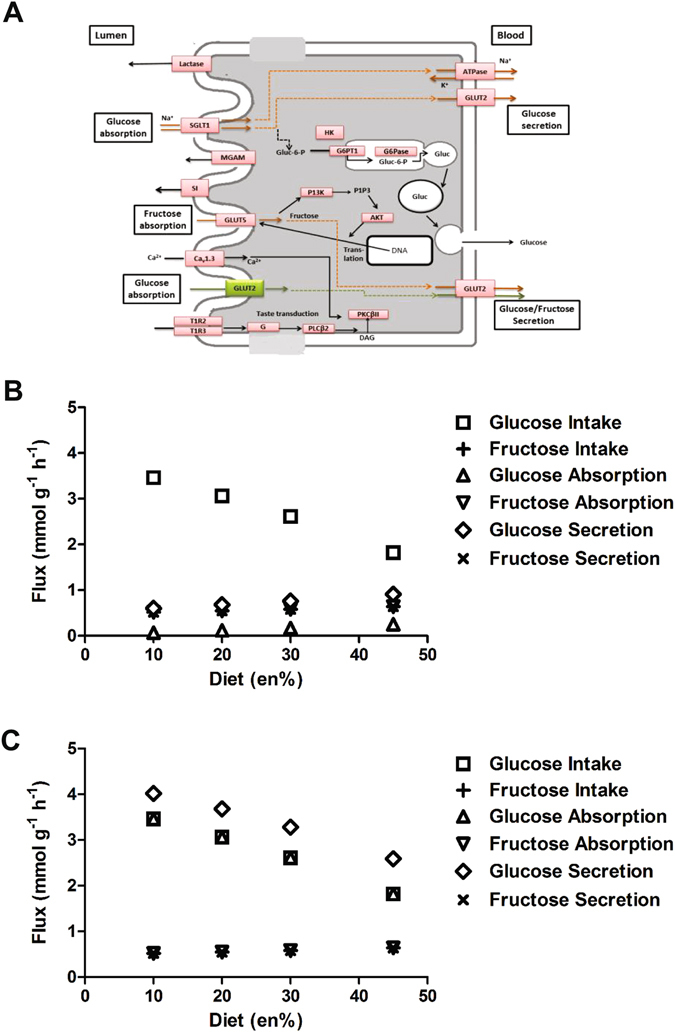
Figure 3.

Carbohydrate metabolism in enterocytes. (A) Schematic overview of carbohydrate absorption and secretion pathways in murine enterocytes (adapted from KEGG). Apical and basolateral location of GLUT2 has been included in the graph; (B) Simulated maximal glucose and fructose absorption and secretion rates modelled in the absence of apically located GLUT2; (C) Simulated maximal glucose and fructose absorption and secretion rates modelled in the presence of apically located GLUT2.
