Figure 2.
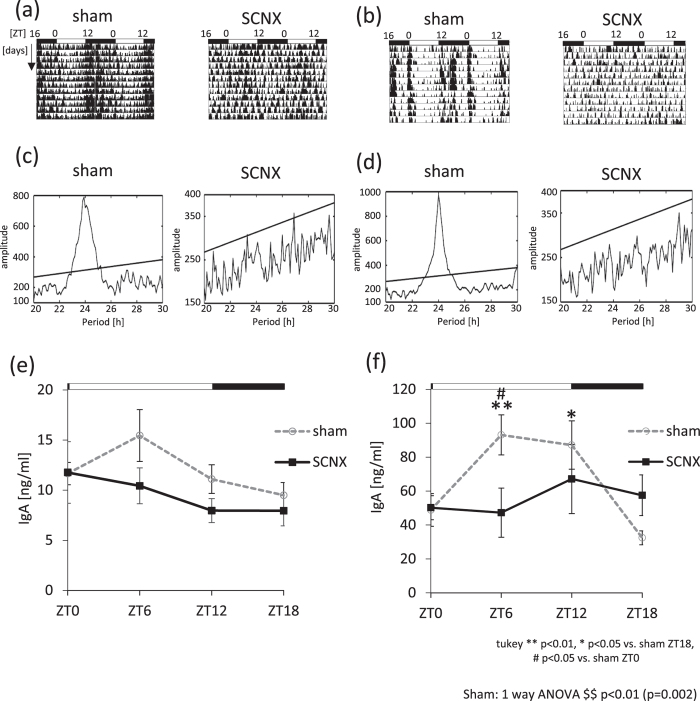
The circadian rhythms of salivary IgA secretion in SCN-lesioned mice. (a,b) Representative double-plotted actograms of locomotor activity for one sham mouse and one SCNX mouse after pilocarpine (a) or NE administration (b). (c,d) Representative Chi-squared periodogram analysis of behavioral data for one sham mouse and one SCNX mouse after pilocarpine (c) or NE (d) administration. Straight lines in each figure indicate statistical significance. (e,f) Salivary IgA concentration rhythms in non-SCN-lesioned (sham) and SCN-lesioned (SCNX) after pilocarpine (e) or NE administration (f) (n = 4–6). Values are shown as mean ± SEM. (f) $$p < 0.01, sham group (one-way ANOVA). **p < 0.01, *p < 0.05 vs. sham ZT18. #p < 0.05 vs. sham ZT0.

