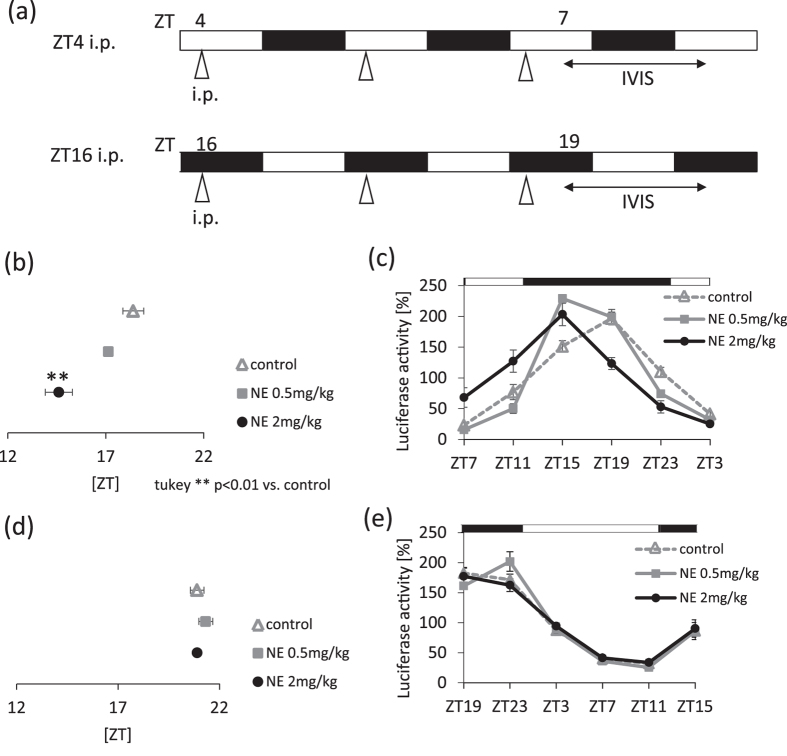
Figure 4.
Sensitivity of the submandibular gland clock to sympathetic nerve stimulation, as evaluated by IVIS in PER2::LUC mice. (a) Experimental schedule. White and black bars indicate 12 hours of light and dark. Triangles under the white and black bars indicate the time at which the reagents were administered intraperitoneally. Bi-directional arrows under the white and black bars indicate the period of measurement using IVIS. (b,c) Average peaks of phase of PER2::LUC rhythms (b) and PER2::LUC expression rhythms (c) in submandibular glands after mice were administered the reagent at ZT4 for 3 days (n = 3–6). (d,e) Average phase peaks of PER2::LUC rhythms (d) and PER2::LUC expression rhythms (e) in submandibular glands after mice were administered the reagent at ZT16 for 3 days (n = 4–8). Values were shown as the means ± SEM. (b) **p < 0.01, control vs. NE 2 mg/kg (one-way ANOVA with Tukey post-hoc test).

