Figure 1.

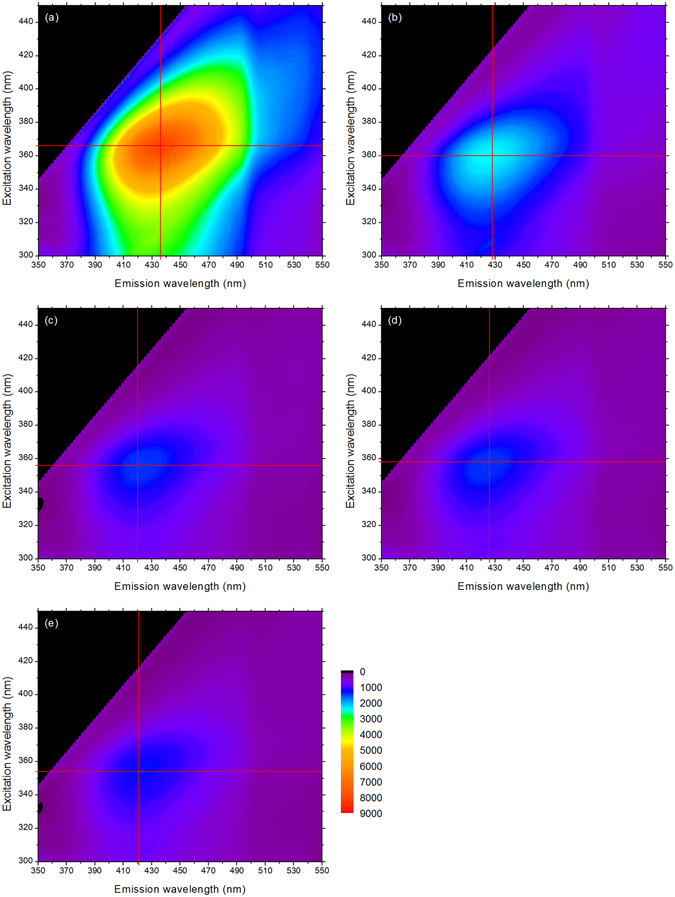
3D fluorescence contour map of miscanthus (a) untreated sample and pretreated samples with (b) CSF = 2.0, (c) CSF = 2.6, (d) CSF = 2.7, (e) CSF = 2.8. The red cross indicates the maximum fluorescence intensity value.

3D fluorescence contour map of miscanthus (a) untreated sample and pretreated samples with (b) CSF = 2.0, (c) CSF = 2.6, (d) CSF = 2.7, (e) CSF = 2.8. The red cross indicates the maximum fluorescence intensity value.