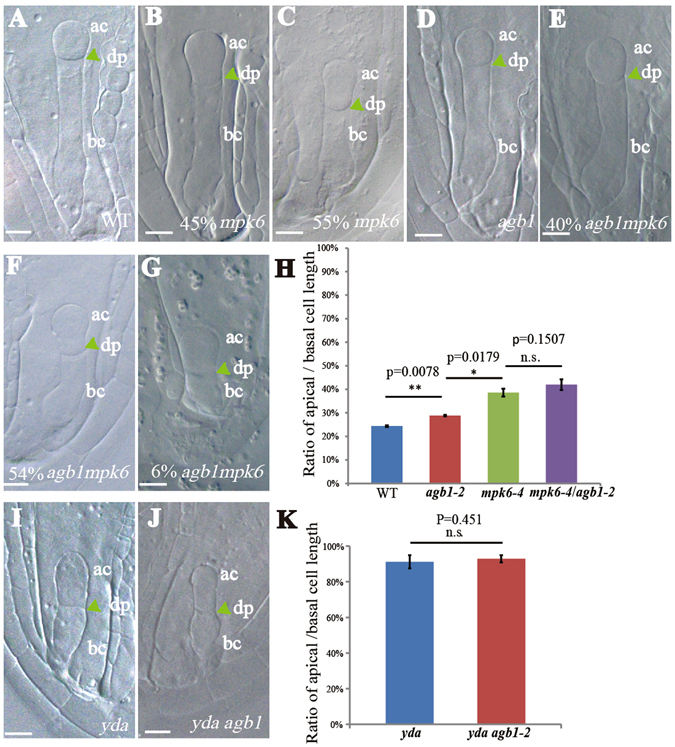
Figure 5.

Zygotic phenotype of mpk6, yda and agb1 mutants. (A–G) Representative images of the two-cell stage zygote in the wild type (A) and mpk6-4 (B and C), agb1-2 (D), yda-8 (I) and m6-4 agb1-2 (E to G), yda-8 agb1-2 (J) mutants. (H and K) Statistical ratio of apical/basal cell length. Averages ( ± SE, n ≥ 30 per genotype) were determined in three independent experiments. ac, apical cell; bc, basal cell; dp, division plane. Students’ t test. p* < 0.05, p* < 0.01. n.s. no significance. Bars = 10 μm.
