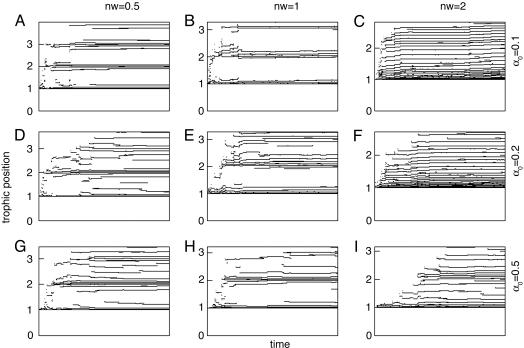
Fig. 2.
Food-web structure. The evolution of simulated food webs during 108 time steps for three values of niche width (nw) and competition intensity (α0) is shown. Trophic position is computed as explained in Model and Methods. Because this measure is strongly correlated with body size, similar patterns would be obtained by using body size. The following parameter values were used in these simulations: I = 10, e = 0.1, v = 0.5, γ0 = 1, d = 2, f0 = 0.3, m0 = 0.1, and β = 0.25.

