Figure 1.
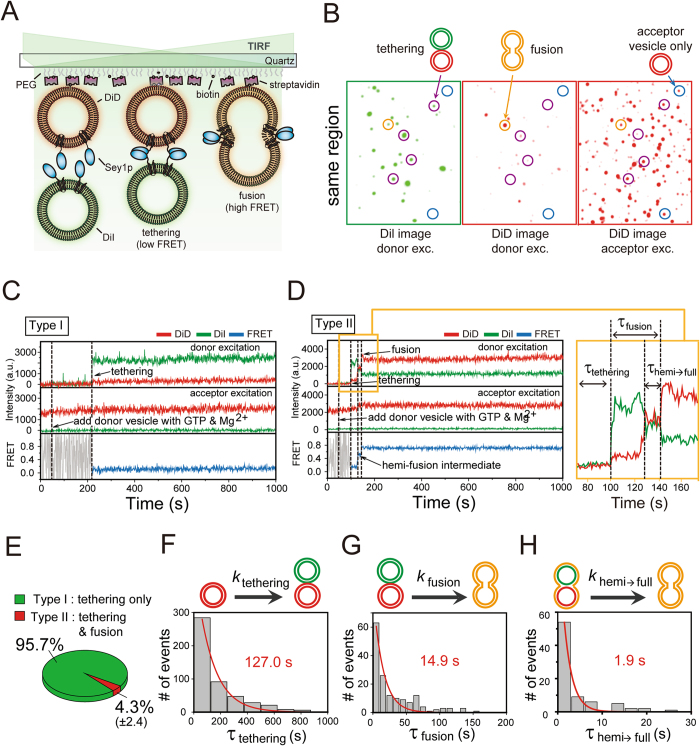
Real-time observation of Sey1p-mediated ER membrane fusion. (A) Schematic diagram of the single-vesicle FRET fusion assay. (B) Single-vesicle images after the addition of donor vesicles containing Sey1p protein to surface-immobilised acceptor vesicles containing the Sey1p protein upon donor (532 nm laser) and acceptor (637 nm laser) excitation. Tethered and fused vesicles are shown in single-vesicle images. DiI signals are from tethered or fused vesicles under donor excitation (left). DiD signals are from surface-immobilised acceptor vesicles only under acceptor excitation (middle) and from fused vesicles under donor excitation (right). Blue, purple and orange circles indicate where acceptor vesicles only, tethered vesicles and fused vesicles are located, respectively. (C,D) Representative time traces showing tethering only (C) or both tethering and fusion events (D) in the presence of 0.5 mM GTP and 1 mM Mg2+. DiI fluorescence, DiD fluorescence and the corresponding FRET efficiency are shown in green, red and blue, respectively. The same colour convention is used throughout the paper. (E) Fractions of traces showing tethering only and both tethering and fusion events. These fractions were determined by analysing at least 900 tethering events from three independent experiments. (F–H) Dwell time histograms for individual reaction steps denoted in Fig. 1D, including the tethering (F), fusion (G) and hemi-to-full fusion (H) steps. All histograms were fitted to single-exponential decay functions to obtain kinetic rates. Dwell time histograms for tethering, fusion and hemi-to-full fusion steps were obtained by analysing 481, 159 and 84 events, respectively. Experiments were performed using proteoliposomes with a protein-to-lipid ratio of 1:200.

