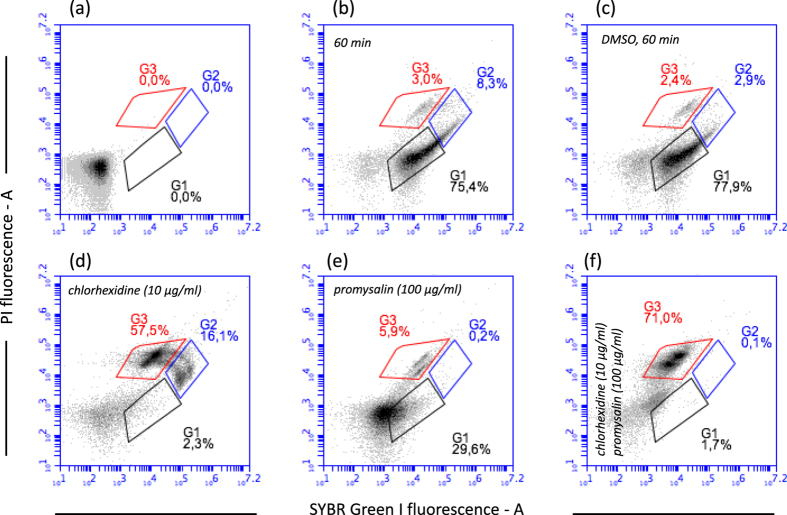
Figure 3.
Membrane damage in P. aeruginosa ATCC 10145 exposed to promysalin, chlorhexidine, and to a mixture of the two molecules. Flow cytometry density diagrams show the SYBR Green I vs PI fluorescence of cells exposed to promysalin or chlorhexidine or both the molecules. Viable cells are gated in G1, viable cells with slightly damaged cell membrane are gated in G2. Dead cells with damaged membrane are gated in G3. The transition of cell population from gate G1 to gate G3 is related to the entity of cell membrane damage. (a) P. aeruginosa unlabeled cells. (b) P. aeruginosa cells incubated 60 min at 37 °C. (c) P. aeruginosa cells incubated 60 min at 37 °C in presence of DMSO. (d) P. aeruginosa cells incubated 60 min at 37 °C in presence of chlorhexidine (10 µg/ml). (e) P. aeruginosa cells incubated 60 min at 37 °C in presence of promysalin (100 µg/ml). (F) P. aeruginosa cells incubated 60 min at 37 °C in presence of chlorhexidine and promysalin (10 µg/ml and 100 µg/ml respectively). DMSO was added to cell suspension in the same amount which was present in the promysalin solution.

