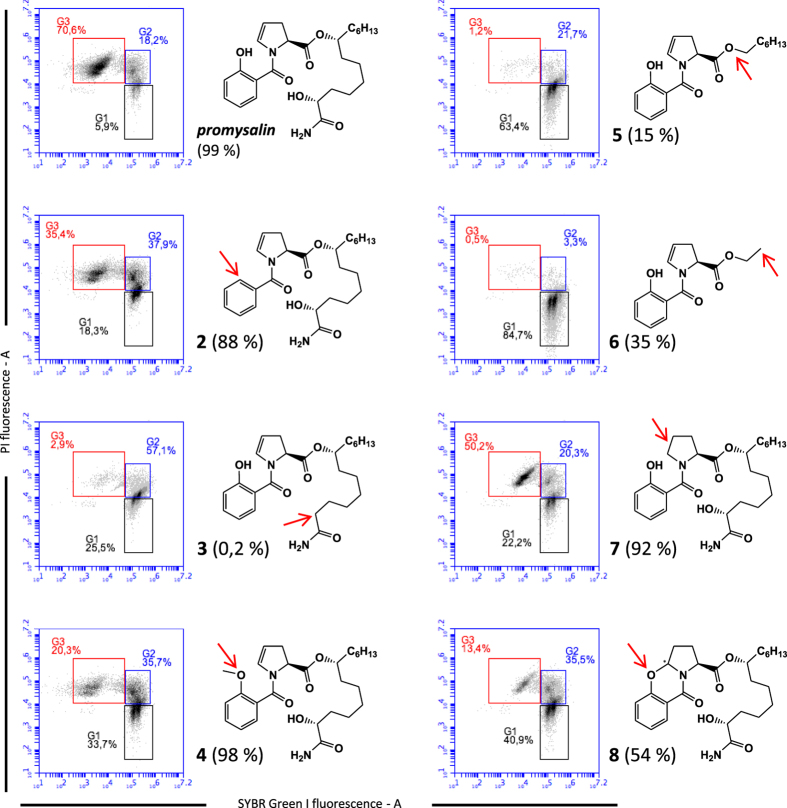
Figure 7.
The effect of promysalin and the derivative analogs on S. thermophilus DSM 20617 T cell membrane integrity and cell viability. Flow cytometry density diagrams show the SYBR Green I vs PI fluorescence of cells exposed to promysalin or to the analogs 2–8 (100 µg/ml). Viable cells are gated in G1, viable cells with slightly damaged cell membrane are gated in G2. Dead cells with damaged membrane are gated in G3. The transition of cell population from gate G1 to gate G3 is related to the entity of cell membrane damage. The reduction of cell viability measured by standard plating was shown in parenthesis. The reduction of cell viability was calculated using as reference (100% of viability reduction) the bactericidal effect of chlorhexidine. The differences in structure between promysalin and the analogs are indicated by the red arrows. Flow cytometry density diagrams showing the SYBR Green I vs PI fluorescence of cells exposed to chlorhexidine or DMSO are shown in SI, Figure S5.

