
Figure 3.
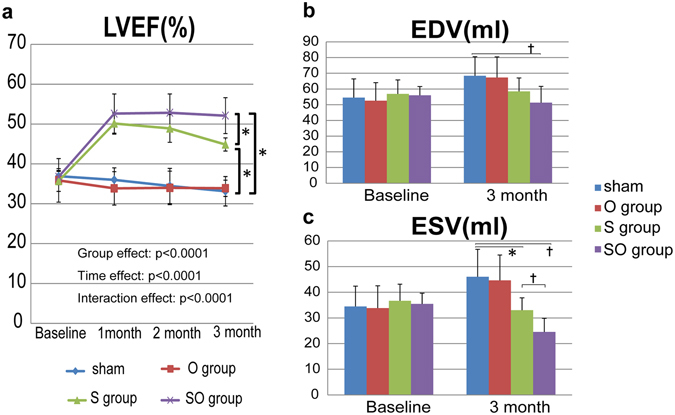
CMR analysis for global cardiac functions: LVEF in a, LVEDV in b, and LVESV in c. (a) LVEF at 3 months was significantly greater in the SO group than in the S group. (b) LVEDV at 3 months in combination group showed significantly smaller than those in the sham group. (c) LVESV at 3 month in the S and SO group showed significantly smaller than that in the sham group. LVESV at 3 months were significantly smaller in the SO group than in the S group. †p < 0.05, *p < 0.01.