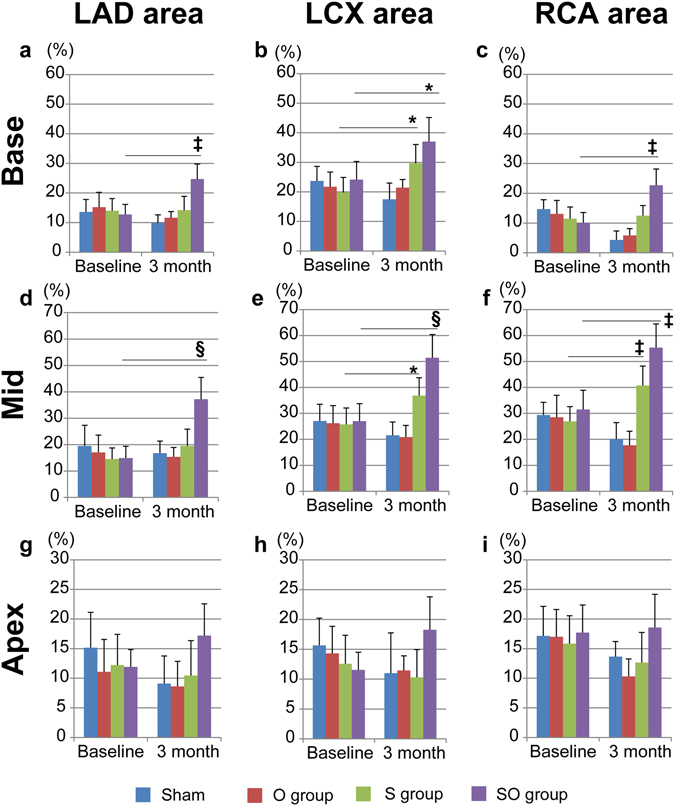
Figure 4.

CMR analysis for regional wall motions (a–i). Regional wall motions at baseline and at 3months after treatments were compared. In the S group, improvements of regional wall motions were demonstrated in 3 regions in (b,e,f). In the SO group, improvements of regional wall motions were observed in 6 regions in (a–f). Any regional wall motions at apex level had not changed significantly in all treatment groups in (g–i). †p < 0.05, *p < 0.01, ‡p < 0.001, §p < 0.0001 vs. baseline.
