
Figure 3.
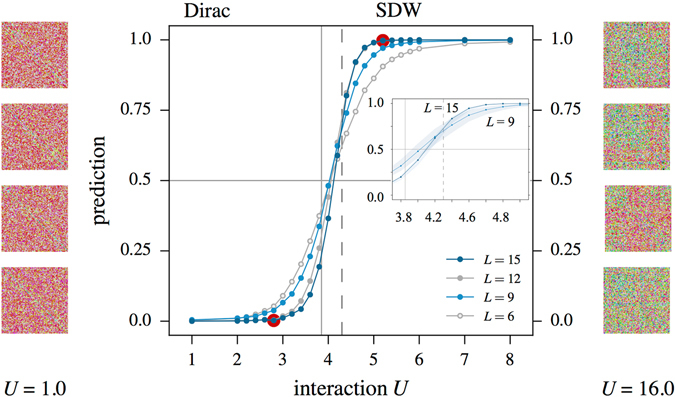
Machine learning of the phase transition from a semi-metal to an antiferromagnetic insulator in the spinful Hubbard model (4) on a honeycomb lattice using the Green’s function approach (see main text). Visualized in the side panels are representative samples of the Green’s function (calculated from the auxiliary field) for a 2 · 9 × 9 system in the two respective phases. The complex entries of these matrices are color-converted by interpreting their absolute value as the hue of the color while their angle is chosen as the saturation (HSV coloring scheme41). The main panel shows the output of the discriminating function F obtained from a CNN trained for parameters in the two fermionic phases (indicated by the red dots). Data for different system sizes 2 · L × L are shown where the colors were selected to highlight an apparent even-odd effect in the linear system size. The vertical solid line indicates the position of the phase transition in the thermodynamic limit37, while the dashed line marks the position at which the antiferromagnetic order breaks down42 for the finite system sizes of the current study.