
Figure 1.
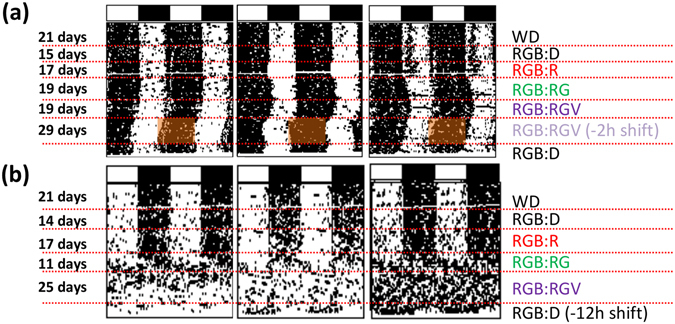
Actograms. Representative wheel running activity (WRA) double-plotted actograms from three degus (a) and three rats (b). White and black bars at the top of the actograms represent the daytime period (12 h) and night-time phase (12 h), respectively. Different light cycles throughout the experiment are shown on the right and indicated by dashed lines in the actograms. Animals were exposed to a combined red-green-blue LED (RGB) illumination for 12 h during the day. At night, they were subjected to different conditions: i) darkness (D); ii) red lights (R); iii) combined red-green LED (RG) lights; and iv) combined red-green-violet LED (RGV) lights. The (−2 h shift) indicates a 2 h phase advance of the RGB:RGV schedule (in degus) or a 12 h phase advance (−12 h shift) of the RGB:D cycle for rats. For more details on the lighting conditions, please see the methods section.