
Figure 8.
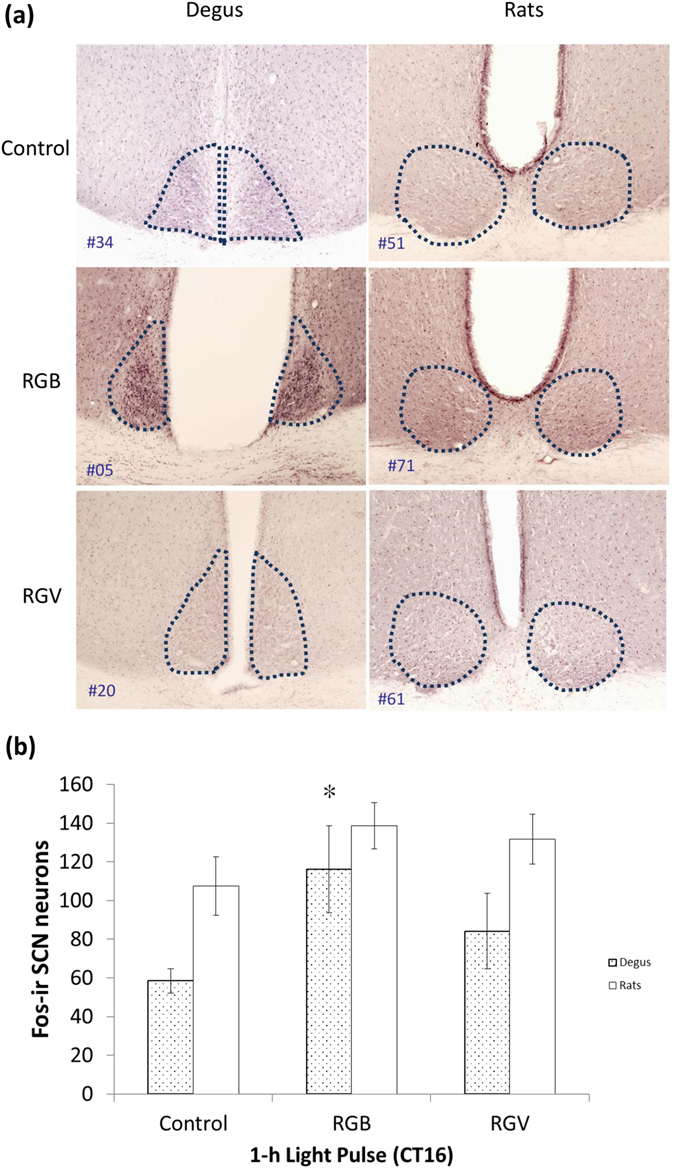
Effect of light on the suprachiasmatic nuclei. (a) Representative photomicrographs showing Fos-immunoreactivity in the suprachiasmatic nuclei (SCN) of degus (left panel) and rats (right panel) under each experimental condition: control animals, which received no light pulse (darkness), and after 1-hour light pulse at CT16 with RGB or RGV lights. The SCN area is delimited by dotted lines. (b) Quantification of Fos-immunoreactive neurons (counted on the left part of the SCN) in the control group (no light pulses, n = 9 degus; 4 rats), the RGB group (pulsed for 1 h with RGB light at CT16, n = 7 degus; 4 rats) and the RGV group (pulsed for 1 h with RGV light at CT16, n = 7 degus; 4 rats). Data are expressed as the mean ± SEM. *Indicates significant differences compared to control degus (Kruskal-Wallis, p = 0.030; Mann-Whitney U test, p = 0.034).