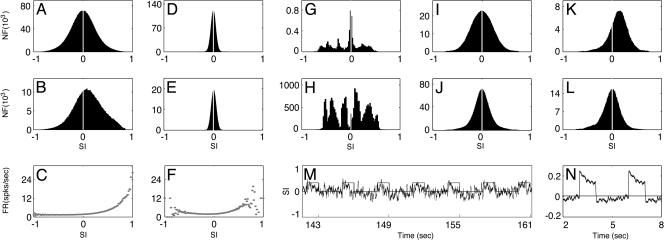
Fig. 3.
Similarity index of different dynamical regimes. (A, D, and G) The distribution PA(SI) of the all-time SI for the IDS, homogeneous, and locked states, respectively. The all-time SI was computed by spatially correlating VP(x; θd) for a fixed θd with the instantaneous spontaneous voltage pattern frames sampled at the rate νS = 1 frame per millisecond for a total duration T = 256 s. (B, E, and H) The distribution PS(SI) of the spike-triggered SI for the IDS, the homogeneous state, and the locked state, respectively. The spike-triggered SI was computed by spatially correlating VP(x; θd) for the same fixed θd as in A, D, and G, with the instantaneous spontaneous voltage patterns sampled only on the spike times of NSI neurons that have the same orientation preference θop = θd in a small area for the same duration T = 256 s. (We used the number of neurons NSI = 64 instead of one neuron here to improve statistics.) (C and F) The firing rate (spikes per second) as the function of the SI for the IDS and the homogeneous state, respectively. This curve is constructed by [(PS(SI)/NSI)/PA(SI)] × νS. (I and J) We collected instantaneous voltage pattern frames V(x, t, θd) (sampled at the rate νS) evoked by drives of all possible orientations, θd ∈ [0, π). (I) The ON distribution of SI. The values of SI used to obtain the ON distribution were generated by correlating each V(x, ton, θd) (frames recorded over the stimulus-on intervals) with the PCS VP(x; θop) of a neuron. (J) The OFF distribution of SI, similarly obtained by using V(x, toff, θd) (frames recorded over the stimulus-off intervals). (K and L) We collected instantaneous voltage pattern frames V(x, t, θop) (sampled at the rate νS) evoked by the drive of fixed θd = θop of a neuron. (K) The ON distribution of SI. The values of SI used to obtain the ON distribution were generated by correlating each V(x, ton, θop) (frames recorded over the stimulus-on intervals) with the PCS VP(x; θop) of the neuron. (L) The OFF distribution of SI, similarly obtained by using V(x, toff, θop) (frames recorded over the stimulus-off intervals). [The ordinate for A, B, D, E, and G–L is the number of frames (NF).] (M) The time trace of SI, ϱ(θop; t), under a periodic drive of orientation θd = θop, which is on for 1 s and then off for 2 s, as indicated by the teeth. (N) The cycle-averaged trace of the SI evolution in M (two cycles displayed).

