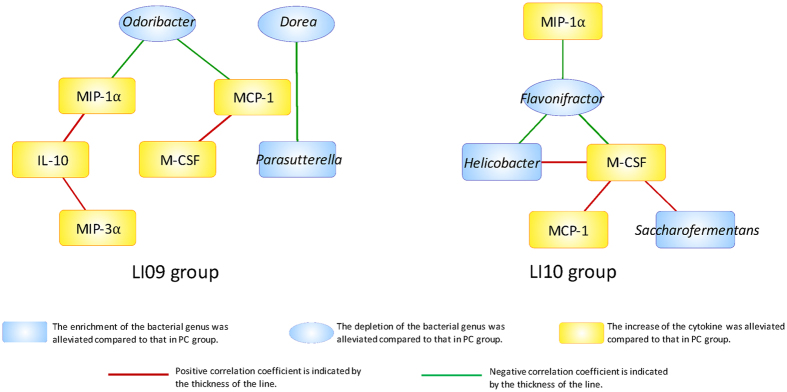
Figure 6.
Correlation-network analysis of plasma cytokines and gut bacterial genera of D-GalN-sensitized rats who received B. pseudocatenulatum LI09 or B. catenulatum LI10. A Spearman correlation analysis was performed, and only correlations with p < 0.05 are displayed. Blue nodes represent bacterial genera, and yellow nodes represent cytokines. The ellipses indicate that the depletion of the bacterial genera was alleviated compared to that in the PC group, and the round rectangles indicate that the enrichment of the bacterial genera was alleviated or the increase of the cytokines was alleviated compared to that in the PC group. A red line connecting nodes represents positive correlation, and a green line represents negative correlation. Values of the corresponding correlation coefficients are indicated by the thickness of the line; the thicker the line, the greater the coefficient.

