Figure 3.

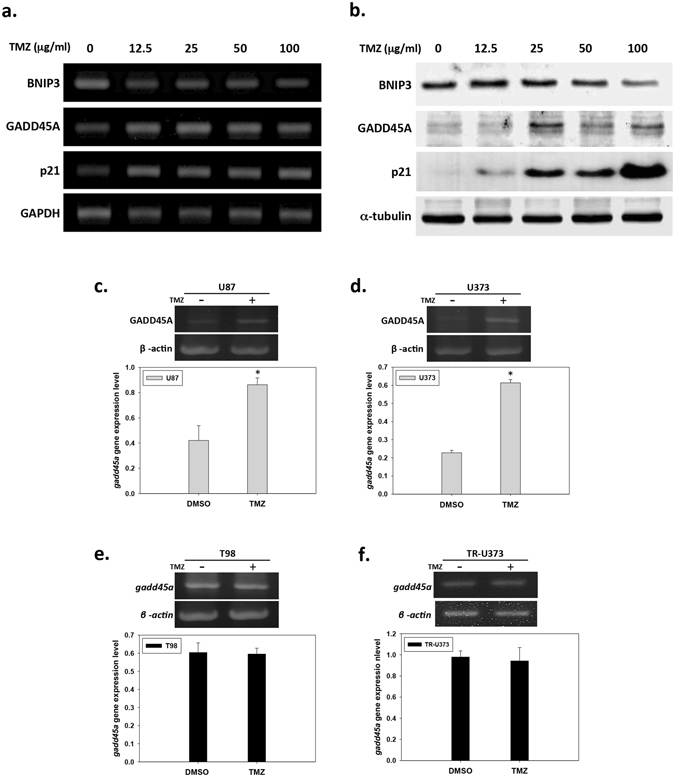
Cell cycle and apoptosis-related genes expression in response to TMZ in human GBM cell lines. (a) Analysis of BNIP3, GADD45A and P21 gene expression pattern at fourth day after TMZ treatment in dose-dependent manner (0 μg/ml, control; 12.5 μg/ml; 25 μg/ml; 50 μg/ml; 100 μg/ml) by RT-PCR. (b) Analysis of BNIP3, GADD45A and P21 gene expression pattern at fourth day after TMZ treatment in dose-dependent manner (0 μg/ml, control; 12.5 μg/ml; 25 μg/ml; 50 μg/ml; 100 μg/ml) by western blotting. Full-length blot was shown in Supplementary Fig. 5. (d),(e) Analysis of the expression of GADD45A in U87, U373, TR-U373 and T98 cells at forth day after TMZ (25 μg/ml) treatment by RT-PCR. The bar graph shows the quantification of GADD45A gene expression level in U87 (c), U373 (d), T98 (e) and TR-U373 (f) cells. Full-length gels were shown in Supplementary Fig. 3. n = 3, *p < 0.05.
