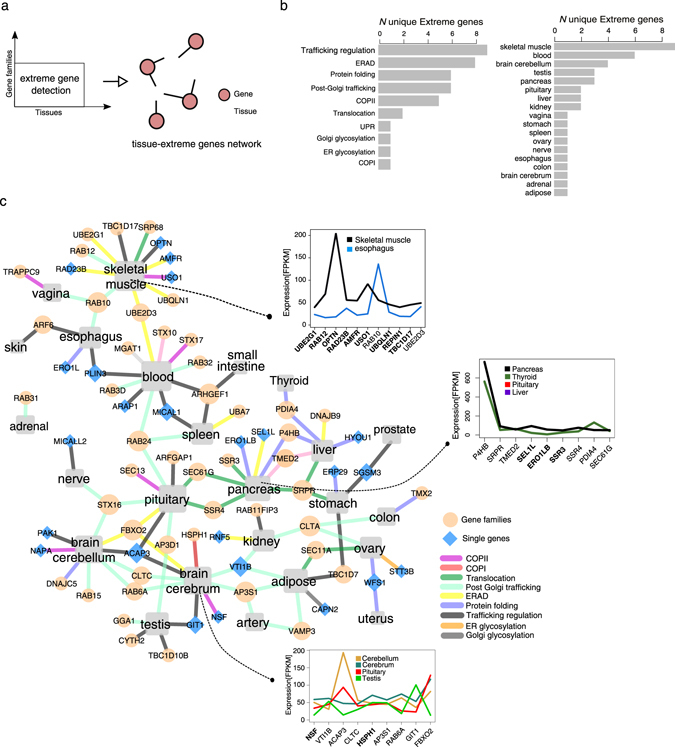
Fig. 4.

Detecting the tissue-specific extreme genes of secretory pathway genes families. a A simple workflow of the detection strategy of the extreme genes is shown. b shows the frequency of the extreme genes per subsystem and per tissue. c The represented network is the reconstructed tissue-extreme gene network. Extreme genes, whether as individual genes (blue diamonds) or as part of a gene family (pale orange circles), were grouped in the associated subsystem, and linked to each tissue (gray box) were they were detected as extreme. The detail expression level for three tissue (skeletal muscle, pancreas, and brain cerebrum) are plotted in the inboxes for their first neighbored detected extreme genes. All other colors not defined in the box refer to other tissue types
