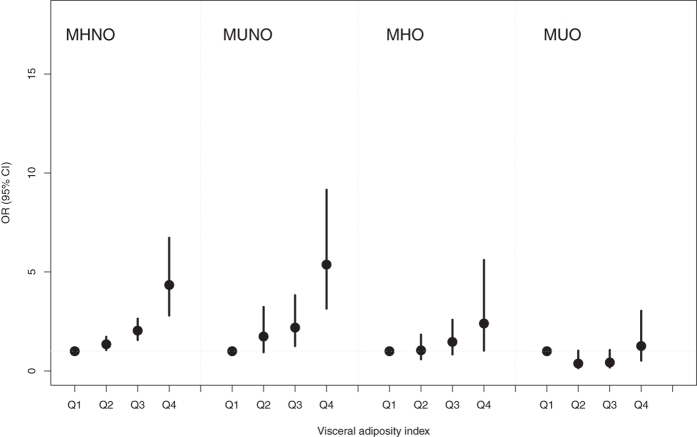
Figure 2.
Adjusted odds ratios (OR) and 95% confidence intervals (CI) for hyperuricemia risk associated with visceral obesity index within each metabolic obesity phenotype defined by ATP-III criteria. Vertical bars are 95% CIs. The adjusted OR was obtained from Model 3: adjusted for age, sex, urban/rural resident, smoking status, alcohol status, white blood cell, total cholesterol, blood pressure, glucose and hs-CRP. Abbreviations: ATP-III, the Adult Treatment Panel-III; MHNO, metabolically healthy non-obese; MUNO, metabolically unhealthy non-obese; MHO, metabolically healthy obese; and MUO, metabolically unhealthy obese.

