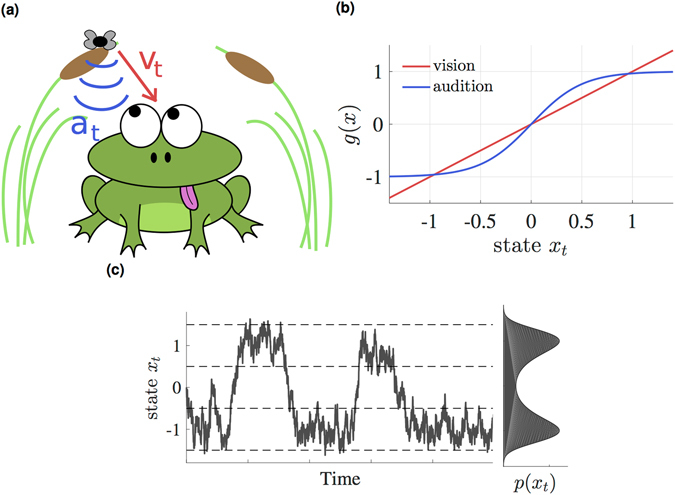
Figure 2.

A toy model illustrating the filtering task for perception. (a) Cartoon of a frog tracking a fly, relying on its visual (v t) and auditory (a t) channels. (b) Nonlinearities in the generative function g(x) of the two sensory channels. Vision is modeled as a linear mapping, while audition is modeled as a sigmoid function. (c) A sample trajectory of the fly according to Eq. (15). Note that the nonlinearity in the drift gives rise to a bimodal stationary distribution p(x t).
