Figure 3.

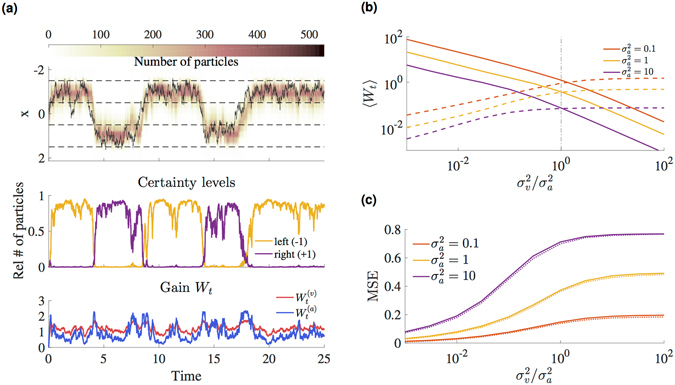
The NPF as a model for perception for multisensory perception. (a) Tracking simulation with N = 1000 filtering neurons and sensory noise . The upper panel shows the true trajectory of the insect (solid black line) and particle densities. The regions between the dotted black lines denote the two branches, and certainty levels in the middle panel correspond to the relative number of particles whose states are within one of the two branches. At each time, the sensory gains in the lower panel are computed according to Eqs (17) and (18). (b) Time-averaged gains (solid line) and (dashed line) as function of sensory noise in multisensory integration. (c) Performance in terms of time-averaged MSE (dotted lines: PF) using both sensory cues v t and a t.
