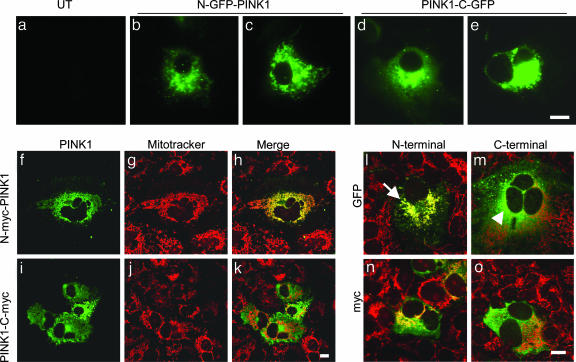
Fig. 3.
Localization of proteins in transfected cells. (a–e) COS-7 cells were transfected with GFP-tagged PINK1 constructs, at either the N terminus (b and c) or the C terminus (d and e) and imaged without fixation or staining. Untransfected cells taken at the same exposure settings are shown as a control in a.(f–k) Cells were transfected, N-terminal (f–h) or C-terminal (i–k) myc-tagged PINK1 and counterstained with MitoTracker. After fixation, myc staining was revealed by using anti-myc monoclonal antibody (green in f and i) and compared with MitoTracker (red in g and h). Merged images are shown in h and k.(l–o) GFP-vs. myc-tagged proteins, showing merged images only. The arrow in l indicates the area of overlap between N-GFP-PINK1 and MitoTracker compared with a cell transfected with PINK1-C-GFP where the signals remain separated (arrowhead in m). (Scale bars: 10 μm.) Each image is representative of at least three experiments performed in duplicate for each construct.

