
Figure 3.
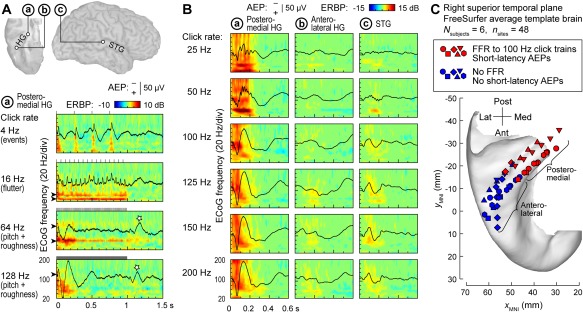
Auditory cortical regions differ in their capacity to track temporal modulations. A: Responses to 1 s click trains from core auditory cortex. Top: location of three exemplary recording sites: a core cortex site in medial Heschl's gyrus (HG), a site in a non‐core field on lateral HG and a superior temporal gyrus (STG) site (marked by a, b, and c, respectively). Bottom: averaged evoked potentials (AEPs) and event‐related band power (ERBP) obtained from site a in response to click trains presented at rates between 4 and 128 Hz (top to bottom rows). Stars indicate off‐response complexes. Arrowheads indicate driving frequencies and their harmonics at which increases in phase‐locked ERBP are seen. Stimulus schematics are shown above each ERBP plot. Modified from Brugge et al.24 B: AEPs and ERBP obtained from the three sites in response to 160 ms click trains presented at rates between 25 and 200 Hz (top to bottom rows). Modified from Nourski et al.49 C: Locations of physiologically defined posteromedial and anterolateral HG sites (red and blue symbols, respectively) in six subjects (different symbol shapes), plotted in Montreal Neurological Institute (MNI) coordinate space and projected onto the FreeSurfer average template brain. Recording sites were assigned to the posteromedial HG region of interest based on the presence of a frequency‐following response (FFR) to 100 Hz click trains and short‐latency (<20 ms) average evoked potential components. Modified from Nourski et al.50