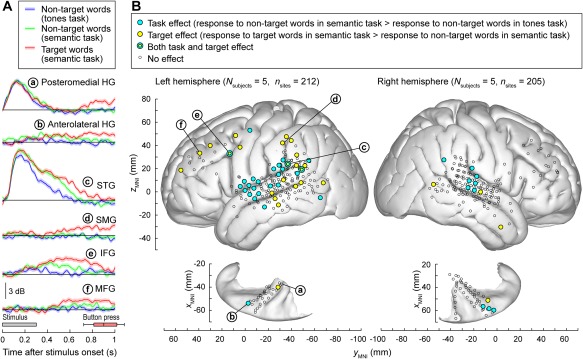
Figure 6.

Task demands have differential effects on auditory and auditory‐related cortical areas. A: Responses to speech stimuli /cat/ and /dog/are shown for representative left hemisphere recording sites (a through e) in posteromedial, anterolateral Heschl's gyrus (HG), superior temporal gyrus (STG), supramarginal gyrus (SMG), inferior and middle frontal gyrus (IFG, MFG).. Colors (blue, green, and red) represent different task conditions. Lines and shaded areas represent mean high gamma event‐related band power (ERBP) and its standard error, respectively. Gray box denotes stimulus duration (300 ms). Horizontal box plot denotes the timing of behavioral responses to the target stimuli (median, 10th, 25th, 75th, and 90th percentiles). Modified from Steinschneider et al. 79 B: Spatial distribution of task and target effects (blue and yellow symbols, respectively). Data from 10 cerebral hemispheres in 9 subjects are plotted in Montreal Neurological Institute (MNI) coordinate space and projected onto FreeSurfer average template brain. Left and right panels depict 212 sites in the left hemisphere and 205 sites in the right hemisphere, respectively. Open symbols indicate sites that exhibited significant high gamma responses to the word stimuli, but did not exhibit either task or target effect. Letters a through e denote projections of the recording sites presented in panel A onto the average template brain. Modified from Nourski et al.81
