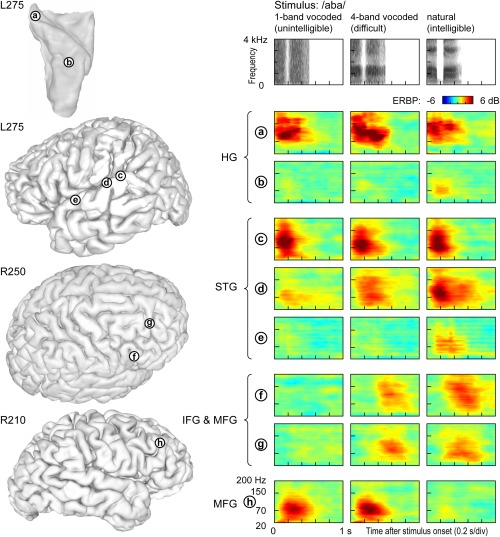
Figure 7.

Responses to spectrally degraded speech are affected by intelligibility and task difficulty. Left: Locations of representative recording sites in Heschl's gyrus (HG), on superior temporal gyrus (STG), inferior and middle frontal gyrus (IFG, MFG) in three subjects. Right: Event‐related band power (ERBP) time‐frequency plots depicting responses to noise‐vocoded (1 and 4 bands) and natural speech stimuli /aba/, recorded from sites a through h (top to bottom). Stimulus spectrograms are shown on top.
