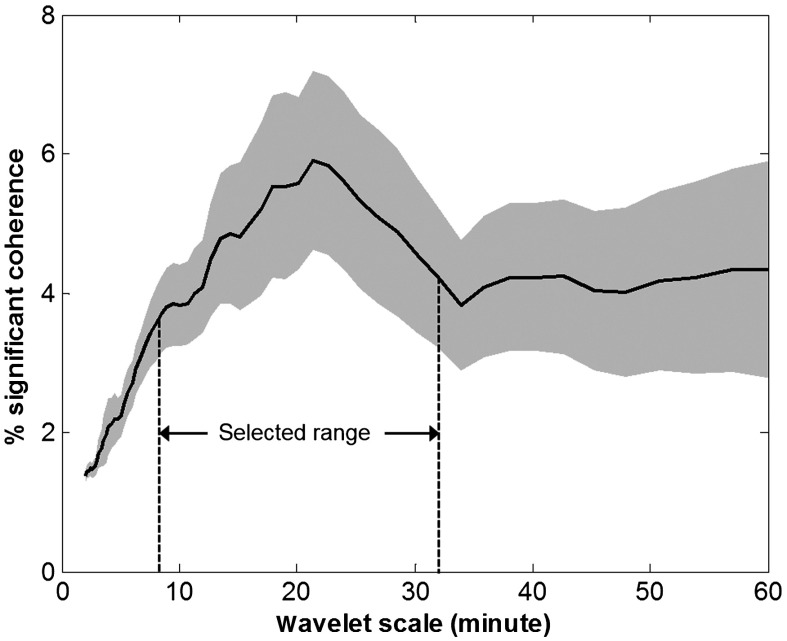
Fig. 3.
Percentage of significant coherence, , derived from the in-phase coherence (i.e., ). In this graph, the -axis represents the wavelet scale, , which is in inverse proportion to Fourier frequency. The -axis represents the percentage of time during which the coherence was statistically significant over the background noise (). Therefore, represented the scale/frequency characteristics of the coherence. For ECMO patients, predominant in-phase coherence was seen in a wavelet scale range of 8 to 32 min (the shaded area), which corresponded to a frequency range of 0.0005 to 0.002 Hz. This range was selected to calculate the autoregulation index.

