
Figure 2. Comparison of TrkA endosome movement dynamics within different cellular compartments.
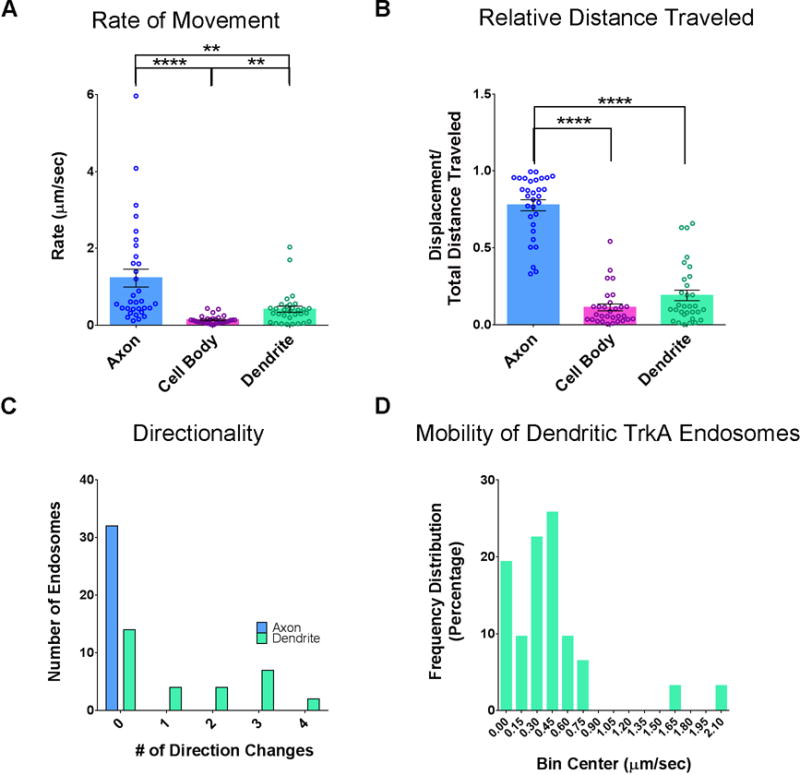
A. The average rate of movement of Flag-TrkA endosomes tracked in axons, cell bodies and dendrites, including stationary endosomes. Kruskal-Wallis test P<0.0001 F (2, 90) = 41.00; post hoc Dunn’s multiple comparisons’ test: for axon vs cell body (CB): ****p<0.0001; for axon vs dendrite **p<0.001; for CB vs dendrite **p<0.001. B. Quantification of relative distance traveled by endosomes in each cellular compartment (displacement over total net movement). Kruskal-Wallis test P<0.0001 F (2, 89) = 57.72; post hoc Dunn’s multiple comparisons’ test: for axon vs CB: ****p<0.0001; for axon vs dendrite ****p<0.0001. A and B n(axon) = 32, n(CB) = 30, n(dendrite) = 31. C. Histogram denoting the number of times an individual endosome changes its direction. D. Frequency distribution of the rate (μm/sec) of TrkA endosomes within dendrites. The first bin is categorized as stationary. Bin size is 0.15 μm/sec. Data are presented as mean ± SEM. See also Figure S1.